Tag Archives: DNA

The origin and spread of Y chromosomes E and J.

Origin, Diffusion, and Differentiation of Y-Chromosome Haplogroups E and J: Inferences on the Neolithization of Europe and Later Migratory Events in the Mediterranean Area


Ornella Semino,1 Chiara Magri,1 Giorgia Benuzzi,1 Alice A. Lin,2 Nadia Al-Zahery,1,4 Vincenza Battaglia,1 Liliana Maccioni,5 Costas Triantaphyllidis,6 Peidong Shen,7 Peter J. Oefner,7 Lev A. Zhivotovsky,8 Roy King,3 Antonio Torroni,1 L. Luca Cavalli-Sforza,2 Peter A. Underhill,2 and A. Silvana Santachiara-Benerecetti1, 2003; 
 
The phylogeography of Y-chromosome haplogroups E (Hg E) and J (Hg J) was investigated in >2,400 subjects from 29 populations, mainly from Europe and the Mediterranean area but also from Africa and Asia. The observed 501 Hg E and 445 Hg J samples were subtyped using 36 binary markers and eight microsatellite loci. Spatial patterns reveal that (1) the two sister clades, J-M267 and J-M172, are distributed differentially within the Near East, North Africa, and Europe; (2) J-M267 was spread by two temporally distinct migratory episodes, the most recent one probably associated with the diffusion of Arab people; (3) E-M81 is typical of Berbers, and its presence in Iberia and Sicily is due to recent gene flow from North Africa; (4) J-M172(xM12) distribution is consistent with a Levantine/Anatolian dispersal route to southeastern Europe and may reflect the spread of Anatolian farmers; and (5) E-M78 (for which microsatellite data suggest an eastern African origin) and, to a lesser extent, J-M12(M102) lineages would trace the subsequent diffusion of people from the southern Balkans to the west. A 7%–22% contribution of Y chromosomes from Greece to southern Italy was estimated by admixture analysis.

References  It has been proposed that the observed decreasing frequency gradients of Y-chromosome superhaplogroups E (Hg E) (defined by the SRY4064 mutation) and J (Hg J) (characterized by the 12f2a-8kb allele) (Semino et al. 1996; Hammer et al. 1998; Rosser et al. 2000) reached southwestern Europe as a result of demic expansions of Neolithic agriculturalists from the Middle East (Semino et al. 1996; Hammer et al. 1998). The spatial frequency patterns of Hg E and Hg J, at this level of molecular resolution, accommodate both infiltrations of Neolithic agriculturalists into southwestern Europe and cultural adaptations in western and northern Europe by indigenous Mesolithic peoples. This is consistent with the Neolithic migration hypothesis (Ammerman and Cavalli-Sforza 1984; Cavalli-Sforza 2002). However, this first-order level of molecular resolution does not readily reflect apparent complexities in regional and local archaeological sequences. The archaeological records suggest that the large-scale clinal patterns of Hg E and Hg J reflect a mosaic of numerous small-scale, more regional population movements, replacements, and subsequent expansions overlying previous ranges. The recent findings of many biallelic markers, which subdivide these two haplogroups, give us the opportunity to investigate the contribution of different population movements that have spread Hg E and Hg J. Through analysis of the Alu insertion (YAP), the M174 and SRY4064 mutations, and the 12f2a deletion, we identified haplogroups D (YAP/M174), E (YAP/SRY4064), and J (12f2a) Y chromosomes in >2,400 males from 29 populations, mainly from Europe and the Mediterranean area but also from Africa and Asia. No subject belonged to the recently reported paragroup DE* (Weale at al. 2003), and only 6 belonged to the Asian-specific Hg D, whereas 501 were members of Hg E and 445 of Hg J. The survey of 36 biallelic markers in the Hg E and Hg J Y chromosomes allowed us to define the phylogenetic relationships of their numerous subclades (figs. 1 and 2) and to analyze their distributions in the various geographic areas (tables 1 and 2). In addition, the survey of eight microsatellites (figs. 3 and 4) in a subset of these samples allowed investigation of the relative dating of different subclades.


Figure 1
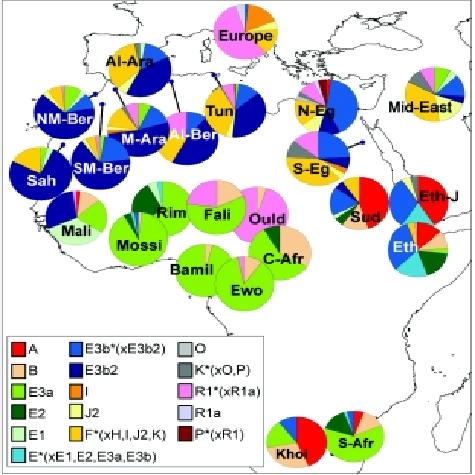
Phylogeny and frequency distributions of Hg E and its main subclades (panels A–G). The numbering of mutations is according to the Y Chromosome Consortium (YCC) (YCC 2002; Jobling and Tyler-Smith 2003). To the left of the phylogeny, the ages (in 1,000 years) of the boxed mutations are reported, with their SEs (Zhivotovsky et al. 2004). Because the procedure used is based on STR data, it actually estimates the ages of STR variation observed within the corresponding haplogroup in the studied populations. With the exception of the value relative to SRY4064 mutation, which as been calculated as TD (with V0=0) between the sister clades Hg E-P2 and Hg E-M33, the other values were estimated as the average squared difference (ASD) in the number of repeats between all current chromosomes of a sample and the founder haplotype, which has an expected value μt for single-step mutations (Thomas et al. 1998) and wt for a general mutation scheme, where w is an average effective mutation rate at the loci, taken as 6.9×10⁻⁴ per 25 years (Zhivotovsky et al. 2004) (microsatellite data available on request). In some cases, because of small sample sizes or long time passed since the occurrence of the mutation, the founder haplotype could not be reliably estimated as a modal haplotype. Therefore, we constructed it from modal alleles at single loci, although this can underestimate the age if the candidate founder haplotype differs from the real one. To make the computation of the P2 and M35 ages independent from those of their most-represented subclades, the STR variation observed at only the “asterisk” lineages (e.g., E-P2*) has been used. The M35 estimate is in agreement with those of Bosch et al. (2001) and Cruciani et al. (2004 [in this issue]), obtained with different methods. The YAP insertion was studied as an amplified fragment-length polymorphism (Hammer and Horai 1995). The other mutations were investigated in a hierarchical order by use of the denaturing high-performance liquid chromatography (DHPLC) methodology (Underhill et al. 2001). Subhaplogroups observed in this study are illustrated by continuous lines, whereas subhaplogroups discussed elsewhere are indicated by dotted lines. For simplicity, the prefix “M” was omitted from the name of the marker mutations. Haplogroup-frequency surfaces were graphically computer reconstructed following the Kringing procedure (Delfiner 1976) by use of the Surfer System (Golden Software) and the data reported in table 1.

 Figure 2
Phylogeny and frequency distributions of Hg J and its main subclades (panels A–F). The numbering of mutations is according to the YCC (YCC 2002; Jobling and Tyler-Smith 2003). To the left of the phylogeny, the ages (in 1,000 years) of the boxed mutations are reported, with their SEs (Zhivotovsky et al. 2004). With the exception of the age relative to the 12f2 mutation, which has been estimated as TD (with V0=0) between the combined data of the two sister clades Hg J-M267 and Hg J-M172, the other values have been determined as ASD, as described in figure 1. The 12f2a marker was examined as an RFLP by Southern blotting (Passarino et al. 1998); the other mutations were investigated in hierarchical order by use of DHPLC methodology (Underhill et al. 2001). Three new mutations, M327, M280, and M390, were found in this study. M327 is a T→C transition at np 404 within the STS containing mutation M92, M280 is a G→A transition at np 330 within the STS containing the mutation M67, and M390 is an A insertion after nt 175 in the STS containing the M365 mutation. Conventions used are the same as for figure 1. The frequency surfaces were drawn using the data reported in table 2 and, for Hg J (panel A), also the data from Rosser et al. (2000), Quintana-Murci et al. (2001), and Scozzari et al. (2001

 Table 1
Population Frequencies of Hg E and Its Subclades


  Hg E


Frequency of E Subhaplogroupb


Hg D


Population/Regiona No. % 2*c 58 191 154 P2* 329 35* 123 78 81 281 33 75 No. %
Arab (Morocco)d (49) 37 75.5                 42.9 32.6          
Arab (Morocco)e (44) 32 72.7 6.8           2.3   11.4 52.3          
Berber (Morocco)d (64) 55 85.9 4.7               10.9 68.7   1.6      
Berber (north-central Morocco)e (63) 55 87.3 9.5           7.9   1.6 65.1   3.2      
Berber (southern Morocco)e (40) 35 87.5 2.5           7.5   12.5 65.0          
Saharawish (North Africa)e (29) 24 82.7 3.4                 75.9   3.4      
Algerian (32) 21 65.6             3.1 3.1 6.3 53.1          
Tunisian (58) 32 55.2 3.4           3.4 5.2 15.5 27.6          
Malif (44) 37 84.1 20.5                 29.5   34.1      
Burkina Fasod (106) 105 99.1 67.9 1.9 13.2       .9         3.8 11.3    
North Cameroond (152) 69 45.4 20.3   12.5           1.3     7.9 3.3    
South Cameroond (89) 83 93.3 43.8   40.4 9.0                      
Senegaleseg (139) 136 97.8 80.6   .7   2.9   5.0   .7 .7   5.0 2.9    
Bantu (South Africa)f (53) 44 83.0 54.7 5.7   3.8 1.9   1.9           15.1    
Khoisan (South Africa)d (90) 59 65.6 31.1   11.1 1.1     16.7           5.6    
Sudanf (40) 12 30.0                 17.5 5.0   2.5 5.0    
Ethiopian (Oromo)g (78) 62 79.5         12.8 2.6 19.2 5.1 35.9   2.6   1.3    
Ethiopian (Amhara)g (48) 22 45.8         10.4   10.4 2.1 22.9            
Iraqi (218) 20 9.2 .9             2.8 5.5            
Lebanese (42) 8 19.0               4.8 11.9 2.4          
Ashkenazim Jewish (77) 14 18.2             1.3 11.7 5.2            
Sephardim Jewish (40) 12 30.0             2.5 10.0 12.5 5.0          
Turkish (Istanbul) (46) 6 13.0               2.2 8.7 2.2          
Turkish (Konya) (117) 17 14.5               1.7 12.8         1 .9
Georgian (41) 0 .0                              
Balkarian (southern Caucasus) (39) 1 2.6                 2.6            
Northern Greek (Macedonia) (59) 12 20.3               1.7 18.6            
Greek (84) 20 23.8               2.4 21.4            
Albanian (44) 11 25.0                 25.0            
Croatian (57) 5 8.8               1.8 7.0            
Hungarian (53) 5 9.4               1.9 7.5            
Ukrainian (93) 8 8.6               1.1 7.5            
Polish (99) 4 4.0                 4.0            
Italian (north-central Italy) (56) 6 10.7                 10.7            
Italian (Calabria 1) (80) 18 22.5             1.3 2.5 16.3 1.3   1.3      
Italian (Calabria 2)h (68) 16 23.5             1.5 13.2 5.9     2.9      
Italian (Apulia) (86) 12 13.9               2.3 11.6            
Italian (Sicily) (55) 15 27.3             5.5 3.6 12.7 5.5          
Italian (Sardinia) (139) 7 5.0             .7 1.4 2.9            
Dutch (34) 0 .0                              
Bearnais (27) 1 3.7                 3.7            
French Basque (45) 0 .0                              
Spanish Basque (48) 1 2.1                   2.1          
Catalan (33) 2 6.1                 3.0 3.0          
Andalusian (76) 7 9.2                 3.9 5.3          
Andalusiane (37) 4 10.8             2.7   2.7 5.4          
Hindu (India) (47) 0 .0                              
Tharu (Nepal) (98) 0 .0                           4 4.1
Chinese (65) 0 .0                           1 1.5


Table 2

Population Frequencies of Hg J and Its Subclades

    Frequency of J subhaplogroupb


  Hg J


M172


M267c


Population/Regiona No. % 172* 158 12* 102* 280 47 67* 92* 327 68 Total % 267* 62 365 390
Arab (Morocco)d (49) 20 20.4 10.2                   10.2 10.2      
Arab (Morocco)e (44) 7 15.9                     2.3 13.6      
Berber (Morocco)d (64) 4 6.3                       6.3      
Berber (Morocco)e (103) 11 10.7                     2.9 7.8      
Saharawish (North Africa)e (29) 5 17.2                       17.2      
Algerian (20) 7 35.0                       35.0      
Tunisian (73) 25 34.2 1.4   1.4 1.4             4.1 30.1      
Sudanf (40) 0 .0                              
Ethiopian (Amhara) (48) 17 35.4             2.1       2.1 33.3      
Ethiopian (Oromo) (78) 3 3.8       1.3             1.3 2.6      
Iraqi (156) 79 50.6 10.2     2.6   2.6 4.5 1.3   1.3 22.4 28.2      
Lebanese (40) 15 37.5 20.0           2.5 2.5     25.0 10.0     2.5
Muslim Kurdg (95) 38 40.0                     28.4 11.6      
Palestinian Arabg (143) 79 55.2                     16.8 38.4      
Bedouing (32) 21 65.6                     3.1 62.5      
Ashkenazim Jewish (82) 31 37.8 12.2     1.2     4.9 4.9     23.2 14.6      
Sephardim Jewish (42) 17 40.5 23.8     2.4     2.4       28.6 11.9      
Turkish (Istanbul) (73) 18 24.7 11.0           2.7 4.1     17.8 5.5   1.4  
Turkish (Konya) (129) 41 31.8 17.8     .8   .8 3.1 4.6 .8   27.9 3.1   .8  
Georgian (45) 15 33.3 8.9         2.2 13.3 2.2     26.7 4.4   2.2  
Balkarian (southern Caucasus) (16) 4 25.0 12.5     6.3     6.3       25.0        
Northern Greek (Macedonia) (56) 8 14.3 3.6     5.4     3.6       12.5 1.8      
Greek (92) 21 22.8 4.3     6.5 2.2   4.3 3.3     20.6 2.2      
Albanian (56) 13 23.2       14.3     3.6 1.8     19.6 3.6      
Croatian (48) 3 6.2       6.2             6.2        
Hungarian (49) 1 2.0             2.0       2.0        
Ukrainian (82) 6 7.3 2.4     2.4     1.2 1.2     7.3        
Polish (97) 1 1.0       1.0             1.0        
Italian (north-central Italy) (52) 14 26.9 5.8     9.6     9.6 1.9     26.9        
Italian (Calabria 1) (57) 14 24.6 14.0     1.8     3.5 3.5     22.8 1.8      
Italian (Calabria 2)h (45) 9 20.0 4.4           8.9 6.6     20.0        
Italian (Apulia) (86) 27 31.4 16.3     3.5     2.3 7.0     29.1 2.3      
Italian (Sicily) (42) 10 23.8 11.9           2.4 2.4     16.7 7.1      
Italian (Sardinia) (144) 18 12.5 2.8     2.1     2.8 2.1     9.7 2.8      
Dutch (34) 0 .0                              
Bearnais (26) 2 7.7 3.8     3.8             7.7        
French Basque (44) 6 13.6 13.6                   13.6        
Spanish Basque (48) 0 .0                              
Catalan (28) 1 3.6             3.6       3.6        
Andalusian (93) 8 8.6 2.2     1.1     3.2 1.1     7.5 1.1      
Hunza (Pakistan)f (38) 5 13.2 2.6     7.9             10.5 2.6      
Pakistan-Indiaf (88) 21 23.9 3.4 1.1 2.3 3.4   1.1   4.5     15.9 7.9      
Hindu (India) (76) 4 5.3 2.6     1.3           1.3 5.3        
Tharu (Nepal) (50) 7 14.0 8.0     6.0             14.0        
Central Asiaf (184) 40 21.7 6.5 .5   2.2   .5 1.1 .5   .5 11.9 9.2 .5

 Figure 3

Networks of the STR haplotypes of the main subhaplogroups of Hg E. These networks were obtained by the analysis of a subset of the samples for the following microsatellites: YCAIIa, YCAIIb (Mathias et al. 1994), DYS19, DYS389, DYS390, DYS391, and DYS392 (Roewer et al. 1996). The phylogenetic relationships between the microsatellite haplotypes were determined using the program NETWORK 2.0b (Fluxus Engineering). Networks were calculated by the median-joining method (=0) (Bandelt et al. 1995), weighting the STR loci according to their relative variability in Hg E and, with the exception of E-M81, after having processed the data with the reduced-median method. Circles represent the microsatellite haplotypes. Unless otherwise indicated by a number on the pie chart, the area of the circles and the area of the sectors are proportional to the haplotype frequency in the haplogroup and in the geographic area indicated by the color. The smallest circle of each network corresponds to one Y chromosome. The shaded area in E-M78 indicates the branch characterized by the DYS392-12 allele.

 Figure 4

Network of the STR haplotypes of the main subhaplogroups of Hg J. These networks were obtained by the analysis of a subset of the samples for the following microsatellites: YCAIIa, YCAIIb (Mathias et al. 1994), DYS388 (Thomas et al. 1999), DYS19, DYS389, DYS390, DYS391, and DYS392 (Roewer et al. 1996), by the same procedures used for Hg E (fig. 3). Apart from the YCAII system in Hg J-M267, which was considered as a stable marker in this haplogroup (see text), the STR loci were weighted according to their relative variability in Hg J. The most complex networks, J-M267* and J-M172*, were calculated by the median-joining method (=0) on the preprocessed data with the reduced-median method; the other networks were calculated by using only the reduced-median algorithm. The shaded area in J-M267* indicates the branch characterized by the YCAIIa-22/YCAIIb-22 motif. For the areas of the circles and the sectors, see figure 3. The expansion time of this branch was calculated using TD (Zhivotovsky 2001), which gives 8.7 and 4.3 ky, respectively, for the earliest and the latest bounds of the expansion time. The former estimate was calculated by using the variance in the number of repeats of the remaining six loci, assuming a variance at the beginning of population separation (V0) equal to zero, and thus gives an upper bound for the TD (Zhivotovsky 2001). The latter assumes a linear approximation of the within-population variance in repeat scores as a function of time and takes a predicted value of V0 prior to population split; because the linearity can be achieved in a case of infinite population size only and because each survived haplogroup started from one individual and could maintain small size for a long time, the linear approximation overestimates V0 and thus might be considered as a lower bound for divergence times (L.A.Z., unpublished method).

Hg E (fig. 1A) is observed in Africa, Europe, and the Near East and includes the subhaplogroups E-M33, E-M75, and the most widespread subclade, E-P2. The latter includes three clusters, two of which, E-M2 and E-M35, are the most widespread. Haplogroups E-M33 (fig. 1B), E-M75 (fig. 1C), and the not-shown E-P2* and E-M2 are virtually absent in European populations and appear to be geographically restricted to sub-Saharan Africa. The E-P2* lineages were observed mainly in Ethiopians, whereas E-M2, which is considered a signature of the Bantu expansion (Hammer et al. 1998; Passarino et al. 1998; Scozzari et al. 1999), shows its highest frequency (>80%) in Senegal and has been sporadically observed in North Africa and Iraq. E-M35 (fig. 1D) has been found in Africa, the Near East, and Europe, where it is believed to have arrived in Neolithic times (Hammer et al. 1998; Semino et al. 2000). In particular, from among its subgroups, E-M78 (fig. 1E) is present in Europe, the Middle East, and North and East Africa. However, whereas no preferential YCAII microsatellite motif is observed in the Middle East, prevalent associations with YCAIIa21-YCAIIb19 in Europe and YCAIIa22-YCAIIb19 in Africa are found. E-M81 (fig. 1F) is almost absent in Europe (with the exception of Sicily and Iberia) and the Middle East but characterizes the majority of the Y chromosomes of populations from northwestern Africa. E-M123 (fig. 1G) is spread in the Near East and is also observed in North Africa and Europe but does not reach the western European regions. E-M281 and E-M329 are geographically restricted, having been seen only in Ethiopians (two subjects each). The remaining 37 E-M35* Y chromosomes were found mainly in Africa, with a high frequency in the Ethiopians and the Khoisan.

Both phylogeography and microsatellite variance suggest that E-P2 and its derivative, E-M35, probably originated in eastern Africa. This inference is further supported by the presence of additional Hg E lineal diversification and by the highest frequency of E-P2* and E-M35* in the same region. The distribution of E-P2* appears limited to eastern African peoples. The E-M35* lineage shows its highest frequency (19.2%) in the Ethiopian Oromo but with a wider distribution range than E-P2*. Indeed, it is also found at high frequency (16.7%) in the Khoisan of South Africa (Underhill et al. 2000; Cruciani et al. 2002) (suggesting, once again, their ancient relationship with Ethiopians) and observed in southern Europe (present study). It is interesting that both E-P2* and E-M35* and their derivatives, E-M78 and E-M123, exhibit in Ethiopians the 12-repeat allele at the DYS392 microsatellite locus, an allele scarcely seen (Y-Chromosome STR Database), especially in other haplogroups and other populations (A.S.S.-B., unpublished data). In addition, the Ethiopian DYS392-12 allele is usually associated with the unusually short DYS19-11 allele, which is typical of this area. These findings are not easily explained. One possible scenario is that an ancient differentiation of the E-P2 haplogroup occurred in loco (East Africa). However, this also implies a low mutability of the associated microsatellite motif (DYS392-12/DYS19-11). Alternatively, the microsatellite motif may be due to homoplasy.

The first scenario is more likely, since this unique microsatellite haplotype occurs in E-P2*, E-M35*, and E-M78 but is almost absent in all other haplogroups and populations. In addition, the high stability of the DYS392 locus (Brinkmann et al. 1998; Nebel et al. 2001) and of the shorter alleles of DYS19 (Carvalho-Silva et al. 1999) has been reported elsewhere. Moreover, the observation that the derivative E-M78 displays the DYS392-12/DYS19-11 haplotype suggests that it also arose in East Africa. This is illustrated by the microsatellite network (fig. 3, shaded area), which reveals that the Ethiopian branch harboring DYS392-12 is not shared with either Near Eastern or European populations. The very low frequency of E-M123 in Ethiopia does not allow any inferences about the origin of this clade. The network of E-M78 and that of E-M123 are in agreement with the hypothesis of their ancient presence in the Near East and their subsequent expansion into the southern Balkans. The divergence time (TD) (Zhivotovsky 2001) between the Near East and European lineages has been estimated to a range of 7–14 thousand years (ky) ago. Cinnioğlu et al. (2004) found a high degree of variance of E-M123 in Turkey, which has been interpreted as being due to multiple founders rather than a single early dispersal event that has remained geographically circumscribed. E-M81 has the lowest variance and a compact network (fig. 3), indicating either its relatively recent origin followed by expansion or its recent expansion after a bottleneck. In Europe, this clade is restricted to the southernmost regions, such as Iberia and Sicily, and the absence of microsatellite variation suggests a very recent arrival from North Africa, consistent with previous observations (Bosch et al. 2001). The frequency pattern and the microsatellite network of E-M2(xM191) (fig. 3) indicate a West African origin followed by expansion, a result that is in agreement with the findings of Cruciani et al. (2002).

The 12f2a mutation, which characterizes haplogroup J, was observed in 445 subjects. Hg J harbors two main clades (see phylogeny in fig. 2), J-M267 (Cinnioğlu et al. 2004) and J-M172. J-M172 is the more frequent and currently differentiates into eight subhaplogroups defined by mutations M12/M102, M47, M67/M92, M68, M137, M158, M339, and M340, four of which occur at informative frequencies. The less-heterogeneous clade J-M267 includes all of the other 12f2a Y chromosomes that were reported elsewhere as Eu10 (Semino et al. 2000). Its current level of subdivision includes five scarcely represented subclusters defined by mutations M62, M365, M367/M368, and M369 (Cinnioğlu et al. 2004) and by the new mutation M390. Similar to Hg E, different geographic distributions are displayed by the various subhaplogroups of J (fig. 2). J-M172 (fig. 2C), which occurs as frequently as J-M267 (fig. 2B) in some Middle Eastern populations, is the more prevalent in Europe. Among its subclades, J-M137, J-M158, J-M339, and J-M340 were reported elsewhere as single observations (Underhill et al. 2000; Cinnioğlu et al. 2004) and have not been observed in this study. Likewise, J-M47 and J-M68 characterize very few Near Eastern and Asian samples. However, J-M12 and J-M67 and their derivatives are informative, being diffused in Europe and observed also in Asia. J-M12 is almost totally represented by its sublineage J-M102, which shows frequency peaks in both the southern Balkans and north-central Italy (fig. 2D). The history underlying this apparent affinity remains uncertain. J-M67 (fig. 2E) includes J-M67* lineages (not shown), which are most frequent in the Caucasus, and J-M92, which indicates affinity between Anatolia and southern Italy (fig. 2F). Finally, the J-M172* lineages display a decreasing frequency gradient from the Near East toward western Europe and strongly contribute to the overall gradient of Hg J. J-M267 is notable, since this haplogroup shows its highest frequencies in the Middle East, North Africa, and Ethiopia (fig. 2B) and its lowest in Europe, having been observed only in the Mediterranean area. Of its five subhaplogroups, only two have been observed: the J-M365 (in two Turks and one Georgian) and the new subclade J-M390 (in one Lebanese).

The extent of differentiation of Hg J, observed both with the biallelic and microsatellite markers, points to the Middle East as its likely homeland. In this area, J-M172 and J-M267 are equally represented and show the highest degree of internal variation, indicating that it is most likely that these subclades also arose in the Middle East. However, their different frequencies in different Middle Eastern countries and in Europe suggest distinct demography processes, possibly in population groups that underwent different temporal expansions. This is especially true for J-M172. The majority of its lineages are undifferentiated and thus potentially paraphyletic (fig. 4). Although J-M172* encompasses most of the M172 Y chromosomes in continental Europe and India (Kivisild et al. 2003; present study), their degree of affinity and shared history remain uncertain. The J-M67*, J-M92, and J-M102 representatives reflect more distinctive origins and dispersal patterns. Whereas J-M67* and J-M92 show higher frequencies and variances in Europe (0.40 and 0.32, respectively) and in Turkey (0.32 and 0.30, respectively [Cinnioğlu et al. 2004]) than in the Middle East (0.17 and 0.09, respectively), J-M12(M102) shows its maximum frequency in the Balkans. In spite of the relative high value of variance of this haplogroup in Turkey (Cinnioğlu et al. 2004)—which, however, could be due to multiple arrivals—the pattern of distribution and the network of J-M12(M102) (figs. 2 and 4) are consistent with its diffusion in Europe from the southern Balkans. On the contrary, J-M67* and J-M92 could have arrived in Europe from Anatolia via the Bosphorus isthmus, as well as by seafaring Neolithic populations who reached southern Italy. J-M67* and J-M92 could represent, at least in part, the Y-chromosome component that King and Underhill (2002) found to correlate with the distribution, from Anatolia toward Europe, of archaeological painted pottery and anthropomorphic figurines. On the other hand, J-M67– and J-M12–related lineages have been observed in Pakistan and India; thus, they probably have marked other migratory events, but the small number of J subclades in these regions (Underhill et al. 2000; Kivisild et al. 2003; present study) does not allow an evaluation of the mode and time of their arrival.

Southern Italy (Apulia and Calabria) contains sites of the early Neolithic period (Whitehouse 1968), but we know from history that these regions were subsequently colonized by the Greeks (Peloponnesians). To test the relative contribution of Greek colonists versus putative earlier Neolithic settlers, an admixture analysis (Bertorelle and Excoffier 1998) was performed, using E-M78 and J-M172(xM12) as signatures of Greek and Anatolian lineages, respectively. The Anatolian source population was based on 523 Turks, of whom 118 were J-M172(xM12) and 25 were E-M78 (Cinnioğlu et al. 2004). The Greek population comprised 36 Peloponnesian samples, 5 of which were J-M172(xM12) and 17 of which were E-M78 (R.K., unpublished data). In spite of the small Peloponnesian sample size, the high E-M78 frequency (47%) observed here is consistent with that (44%) independently found in the same region (Di Giacomo et al. 2003) for the YAP chromosomes harboring microsatellite haplotypes (A. Novelletto, personal communication) typical of Hg E-M78 (Cruciani et al. 2004 [in this issue]; present study). The admixture analysis yielded an admixture proportion from Greece of 0.07±0.15 for the Calabrian samples and of 0.22±0.15 for the Apulian samples. SD was determined by bootstrapping 1,000 replicates.

The TD of the two sister clades J-M267 and J-M172 was estimated, with V0=0, and turned out to be 31.7 ky (see phylogeny in fig. 2). This estimate, however, is not easily interpretable, because such old haplogroups are differently represented in different regions where they probably underwent multiple bottlenecks. The lower internal variance of J-M267 in the Middle East and North Africa, relative to Europe and Ethiopia, is suggestive of two different migrations. In the absence of additional binary polymorphisms allowing further informative subdivision of J-M267, the YCAII microsatellite system provides important insights. The majority of J-M267 Y chromosomes harbor the single-banded motif YCAIIa22-YCAIIb22 in the Middle East (>70%) and in North Africa (>90%), whereas this association is much less frequent in Ethiopia and only sporadically found in southern Europe. Considering the distribution of this YCAII single-banded pattern—which, besides the usual stepwise mutational mechanism, could be due to a stable mutational event (one locus deletion or a single-nucleotide mutation in the primer sequence)—we suggest that the motif YCAIIa22-YCAIIb22 potentially characterizes a monophyletic clade of J-M267. A comparable situation is observed within Hg I-M170, in which the single-banded haplotype YCAIIa21-YCAIIb21 parallels a biallelic marker (O.S., unpublished data).

According to this interpretation, the first migration, probably in Neolithic times, brought J-M267 to Ethiopia and Europe, whereas a second, more-recent migration diffused the clade harboring the microsatellite motif YCAIIa22-YCAIIb22 in the southern part of the Middle East and in North Africa. In this regard, it is worth noting that the median expansion time of the J-M267-YCAIIa22-YCAIIb22 clade was estimated to be 8.7–4.3 ky, by use of the TD approach (see fig. 4 legend), and that this clade includes the modal haplotype DYS19-14/DYS388-17/DYS390-23/DYS391-11/DYS392-11 of the Galilee (Nebel et al. 2000) and of Moroccan Arabs (Bosch et al. 2001). These results are consistent with the proposal that this haplotype was diffused in recent time by Arabs who, mainly from the 7th century a.d., expanded to northern Africa (Nebel et al. 2002).

In conclusion, high-resolution Y-chromosome haplotyping and particular microsatellite associations reveal regional population differentiations, an East Africa homeland for E-M78, and recent gene-flow episodes consistent with the Neolithic in Europe. In particular, the spatial distributions of J-M172*, J-M267, E-M78, and E-M123 indicate expansions from the Middle East toward Europe that most likely occurred during and after the Neolithic, that of J-M102 illustrates population expansions from the southern Balkans, and that of E-M81 reveals recent gene flow from North Africa. Distinct histories of J-M267* lineages are suggested: an expansion from the Middle East toward East Africa and Europe and a more-recent diffusion (marked by the YCAIIa-22/YCAIIb-22 motif) of Arab people from the southern part of the Middle East toward North Africa.

Another North African Y chromosome study, a little old now.

High-Resolution Analysis of Human Y-Chromosome Variation Shows a Sharp Discontinuity and Limited Gene Flow between Northwestern Africa and the Iberian Peninsula

 Elena Bosch,1,* Francesc Calafell,1 David Comas,1 Peter J. Oefner,2 Peter A. Underhill,3 and Jaume Bertranpetit1
In the present study we have analyzed 44 Y-chromosome biallelic polymorphisms in population samples from northwestern (NW) Africa and the Iberian Peninsula, which allowed us to place each chromosome unequivocally in a phylogenetic tree based on >150 polymorphisms. The most striking results are that contemporary NW African and Iberian populations were found to have originated from distinctly different patrilineages and that the Strait of Gibraltar seems to have acted as a strong (although not complete) barrier to gene flow. In NW African populations, an Upper Paleolithic colonization that probably had its origin in eastern Africa contributed 75% of the current gene pool. In comparison, ~78% of contemporary Iberian Y chromosomes originated in an Upper Paleolithic expansion from western Asia, along the northern rim of the Mediterranean basin. Smaller contributions to these gene pools (constituting 13% of Y chromosomes in NW Africa and 10% of Y chromosomes in Iberia) came from the Middle East during the Neolithic and, during subsequent gene flow, from Sub-Saharan to NW Africa. Finally, bidirectional gene flow across the Strait of Gibraltar has been detected: the genetic contribution of European Y chromosomes to the NW African gene pool is estimated at 4%, and NW African populations may have contributed 7% of Iberian Y chromosomes. The Islamic rule of Spain, which began in a.d. 711 and lasted almost 8 centuries, left only a minor contribution to the current Iberian Y-chromosome pool. The high-resolution analysis of the Y chromosome allows us to separate successive migratory components and to precisely quantify each historical layer.
The systematic search for polymorphisms in the human Y chromosome, both by conventional techniques and by denaturing high-performance liquid chromatography (DHPLC), is producing a large number of new markers (Underhill et al. 1997, 2000; Shen et al. 2000), overcoming the initial dearth of available polymorphisms on that chromosome (Dorit et al. 1995). Among all the different types of Y-chromosome polymorphisms, base substitutions and insertion/deletion polymorphisms have proved to be especially useful in the reconstruction of the phylogeny of the 30-Mb Y-chromosome nonrecombining region. Given their nature, these mutations have probably arisen only once in evolutionary history and have created biallelic polymorphisms. In the absence of recurrence, the typing of such markers in nonhuman primates allows us to determine which is the ancestral allele. The knowledge of the ancestral and derived states of these markers, together with the fact that most of the Y chromosome does not recombine, allows the direct application of parsimony criteria to obtain its phylogeny. Underhill et al. (2000) developed a new set of markers and typed a large set of samples from different worldwide population, providing a well-established structure for Y-chromosome phylogeny and a wide context of very detailed information on Y-chromosome variation, against which any particular new population can be evaluated. A specific analysis of Europe (Semino et al. 2000) has shown the possibilities of the application of this marker set to a continental framework. Furthermore, because of this well-established phylogeny, we are able to characterize new populations by means of a fast hierarchical approach, in which markers are successively typed from the top to the bottom (from the root toward the branch tips) of the phylogenetic tree, as needed. Given the fine degree of paternal-lineage dissection achieved, the proper knowledge of the worldwide distribution and of patterns of variation of the haplotypes that constitute this phylogeny will pave the way for the elucidation of the patterns of male migration and admixture, among present and past human populations.


In addition to the geographical proximity of northwestern (NW) Africa and the Iberian Peninsula, which are separated only by the 15-km-wide Strait of Gibraltar, both regions are linked by historical events involving population movement. During the Upper Paleolithic (known as the “Late Stone Age” in the study of African prehistory), the Ibero-Maurusian industry, spanning the time period of 22,000–9,500 years ago (ya) (Newman 1995), is found throughout northern Africa. The prefix “Ibero-” refers to the presumption that this culture extended into Iberia, although an origin in the Nile River valley is now widely accepted (Camps 1974). The Ibero-Maurusian culture was followed, in the NW African Mesolithic, by the Capsian industry (10,000–4,700 ya; Desanges 1990). The Capsian culture persists well into the Neolithic (which began ~5,500 ya), a fact that may indicate a persistence of the Mesolithic population and a cultural adoption of agriculture and husbandry with some Neolithic admixture, rather than a replacement by Neolithic populations originating in the Middle East. In general terms, prehistoric culture changes in NW Africa were quite independent of the change dynamics on the European shores of the Mediterranean. In Iberia, the first Upper Paleolithic settlements appear as early as 40,000 ya. Later local developments, until the spread of the Neolithic, followed traditions having European or northern Mediterranean distributions.

NW Africa enters history with the Phoenicians, who, originating in the Middle East, founded Carthage in 814 b.c. and established commercial relations with the local populations, who were the ancestors of the current Berbers. The Roman geographers documented the native kingdoms of the Mauri, Numidae, Gaetali, and Libii, all of whom were subsequently conquered, in ~150 b.c.–a.d. 50, by the Romans, who established themselves, probably with a limited demographic impact, along a 100-km-wide strip along the Mediterranean coast. This has a parallel in the history of Iberia, where Phoenicians and Greeks established trading posts, and where the local populations (Iberians and Celts) were later conquered (starting ~200 b.c.) by the Romans. Iberia (“Hispania”) then became a province of the Roman Empire.

During the 7th century a.d., the Arabs conquered northern Africa from east to west and spread their language and religion throughout the native Berber population. Although the cultural and political impact of this invasion changed the history of NW Africa profoundly, a precise estimation of the demographic contribution of the Arabs to NW Africa is not available. In a.d. 711, Berber troops under Arab leadership (Hitti 1990) crossed to the Iberian Peninsula, which they subsequently conquered. That date marks the start of an 8-century period during which the Iberian Peninsula was divided into the Christian kingdoms to the north and the Islamic kingdoms in the south. The border between the two moved southward until 1492, when the last Islamic kingdom was conquered. The demographic contribution of NW African populations to Iberia is not known precisely; it may have been on the order of tens of thousands of individuals in a total Iberian population of a few million (McEvedy and Jones 1978). After the first conquest of Iberia, two main Berber invasions swept through the peninsula: the Almoravids (a.d. 1056–1147) and the Almohades (a.d. 1121–1269). The empire founded by the former group extended into Africa as far south as present-day Senegal and Mali (Kasule 1998).

After 1492, first Jews and then Moslems were forced by the Spanish rulers to either convert to Catholicism or leave the country. Most of those who were expelled took refuge in NW Africa. However, the population substrate of the Moslem group is not well known; the extent to which this group was composed of converted Iberians rather than of the descendants of the Islamic invaders is difficult to ascertain.

In the present study, we have typed 44 biallelic polymorphisms and 8 microsatellites (also known as “short tandem repeats,” or “STRs”), to define the main Y-chromosome lineages in NW Africa and the Iberian Peninsula, in a well-established phylogeographical frame (Underhill et al. 2000), as well as to attempt to estimate the dates of both ancient and recent events in the history of those populations. Several hypotheses regarding population history are tested, such as those concerning the extent to which the Paleolithic genetic background may still be present in both regions, as well as the impact of the Neolithic wave of advance; we also quantify any gene flow between these two regions and from external populations into these regions. The present results are contrasted with those of previous analyses of classical polymorphisms (i.e., blood groups and protein polymorphisms), Alu-insertion polymorphisms, mtDNA control-region sequences, and other Y-chromosome studies. Previous analyses, of a smaller set of Y-chromosome polymorphisms in populations from NW Africa and the Iberian Peninsula, have been published by Bosch et al. (1999), who emphasized gene genealogy rather than population history, and by Rosser et al. (2000), who typed 11 biallelic polymorphisms in a broad survey of western-Eurasian populations and found that a principal-component analysis of haplotype frequencies separated NW African populations from European and Middle Eastern populations.
 
Different autochthonous samples from NW Africa and the Iberian Peninsula were typed. The NW African sample included blood from 29 Saharawis, 40 southern Moroccan Berbers, 44 Moroccan Arabs, and 63 north-central Moroccan Berbers. Samples from the Iberian Peninsula included blood from 37 Andalusians, 16 Catalans, and 44 Basques; the Basque individuals were also included in the study by Underhill et al. (2000). Appropriate informed consent was obtained from all participants in this study, and information about the geographical origin of their four grandparents and about their first language was recorded. DNA was extracted from fresh blood by standard phenol-chloroform protocols.
Polymorphism Typing
All samples in this study were characterized by means of a top-down approach, in which the markers indicated in figure 1 were successively typed, in hierarchical order, according to their position in the genealogy given by Underhill et al. (2000). The typing methods in our analysis would allow us to identify almost all haplotypes described by Underhill et al. (2000). Thus, the original haplotype notation of Underhill et al. (2000) has been kept.
 DHPLC was used to type all biallelic markers, with the exception of YAP (also known as “M1”). Marker information such as primer sequences and PCR conditions for their amplification, whether alleles are ancestral or derived, as well as additional details for their typing conditions by DHPLC, have been provided by Underhill et al. (1997, 2000). YAP was assayed as described by Hammer and Horai (1995). It should be noted that a subset of the polymorphisms used in the present study has been typed in a number of European populations (Semino et al. 2000) and that a different notation has been given to those haplotypes: H22 is termed “Eu2”; H35, H36, and H38 are subsumed under “Eu4”; H52, H50, H58, and H71 are termed “Eu7,” “Eu8,” “Eu9,” and “Eu10,” respectively; H88 is termed “Eu15;” H101, H102, H103, and H104 are subsumed under “Eu18”; and, finally, H108 is termed “Eu19.”

Data for eight STRs (DYS388, DYS19, DYS390, DYS391, DYS392, DYS393, DYS389I, and DYS389II) were available for almost all chromosomes in the sample (Bosch et al. 1999, and additional typings reported here). Complete haplotypes (biallelic markers and STRs) are available from the authors.

Data Analysis
Haplotype-frequency differences among populations from NW Africa and the Iberian Peninsula were tested, by analysis of molecular variance (AMOVA), with the ARLEQUIN software package (Schneider et al. 2000). AMOVA was performed both separately, for NW African and Iberian populations, and as a joint analysis in which genetic variance was partitioned hierarchically as interregion (NW Africa vs. Iberia) variance, intraregion variance, and intrapopulation variance.
Coalescence analysis (Griffiths and Tavaré 1994) was used to test whether NW Africa and Iberia could be regarded as a panmictic unit, to estimate the amount of gene flow among the two regions, and to estimate the ages of M35, M78, and M81, under assumptions of both constant and exponential growth, by means of the Genetree program (available from the Genetree Web site). All biallelic polymorphisms constituting the haplotypes were given the same weight regardless of whether they were nucleotide substitutions or indels, given that they were all compatible with the infinite-sites model implemented in Genetree. First, the values of θ=Nμ (where N is effective population size and μ is mutation rate) that maximized the likelihood of the gene genealogy were obtained separately for the combined haplotype frequencies and for consideration of the two regions separately (in this case, maximum-likelihood estimates of the Nm migration parameter were also obtained, where m is migration rate per generation, were also obtained); next, the likelihood values obtained in the two scenarios were compared by a likelihood-ratio test, after application of the appropriate combinatorial factor (Bahlo and Griffiths 2000). Mutation-age estimates were obtained by use of the growth, θ, and migration parameters that maximized gene-genealogy likelihood and under the assumptions of an effective population size of 5,000 and a 20-year generation time. Genetree provides mutation-age estimates as multiples of θ; thus, either N or μ should be fixed a priori to transform ages in θ units to ages in generations. We fixed N at 5,000, which is close to the global value obtained by Goldstein et al. (1996). With our estimated θ values and with N set at 5,000, we obtained mutation rates of ~6×10⁻⁹ per nucleotide, a result that is consistent with the nuclear-genome average (Li et al. 1985). All Genetree program executions were run for 1,000,000 iterations.

Phylogenetic relations for STR haplotypes within the haplotypes defined by biallelic polymorphisms were depicted by means of reduced median networks (Bandelt et al. 1995), as implemented in the Network 2.0c program (available from www.fluxus-engineering.com).

Separation times, within Y-chromosome lineages, between NW African and Iberian chromosomes, were estimated from STR haplotypes, by means of the average square distance (ASD) (Thomas et al. 1998), by use of a mutation rate of 2.1×10⁻³ (Heyer et al. 1997; Jobling et al. 1999) and a generation time of 20 years.

 
Male-Lineage Structure of NW African and Iberian Populations
Haplotype frequencies in Moroccan Arabs, north-central Moroccan Berbers, southern Moroccan Berbers, and Saharawis are given in table 1. Haplotype-frequency differences among those populations were tested via AMOVA. Only 0.8% of the genetic variance was found to be due to haplotype-frequency differences among the populations (statistically not significantly different from 0; P=.169). H38, which, according to Underhill et al. (2000), belongs to haplotype group III, is the most common haplotype in NW Africa (64%), with its highest frequencies found within the Saharawis (76%). H71, which belongs to group VI, is the second-most-frequent haplotype (11%) in this area. Other haplotypes, found at lower frequencies, are H22 and H35 (6% each) and H36 (5%), all belonging to group III. The remaining haplotypes, which jointly represent 8% of the NW African Y chromosomes, are found at frequencies of <3%. The genetic homogeneity of NW African Y chromosomes points to a common origin, for all populations analyzed, independent of ethnicity or language (Arab or Berber). These data support the interpretation of the Arabization and Islamization of NW Africa, starting during the 7th century a.d., as cultural phenomena without extensive genetic replacement.
 

Haplotype frequencies for Basques, Catalans, and Andalusians are also given in table 1. AMOVA showed that 2% of the genetic variance was attributable to haplotype-frequency differences among them (statistically not significantly different from 0; P=.08). Pairwise population comparisons via AMOVA did not yield any values significantly different from 0. The most frequent haplotype in these populations is H104 (56%), which belongs to group IX. Haplotypes H102 and H103, which also belong to group IX, are found at frequencies of ~10%. The frequency of H71 (8%) is similar to that haplotype’s frequency in NW Africa. The proportion of haplotypes belonging to group VI (which includes H71) is slightly higher in Iberia (16%) than in NW Africa (14%). H35, H36, and H38, the only haplotypes found to belong to group III, constitute 5% of the Iberian Y chromosomes.

These results clearly show that the contemporary populations from both regions originated from different patrilineages: group III haplotypes prevail in NW Africa, whereas Iberian haplotypes belong mostly to group IX. The proportion of genetic variance that can be attributed to the difference between the NW African and Iberian populations is 35.2% (P=.024), the minimum possible value, given the number of populations and the permutation procedure employed to estimate statistical significance (Excoffier et al. 1992). Moreover, a coalescence analysis of the gene genealogy (Bahlo and Griffiths 2000), including haplotype frequencies in both regions, allowed us to reject the hypothesis that they behave jointly as a panmictic unit (χ2=271.69, 1 df, and P≈0, for constant population sizes; and χ2=266.47, 1 df, and P≈0, for expanding populations). The migration parameters that maximized gene-genealogy likelihood were Nm=1.25 from Iberia to NW Africa and Nm=2 from NW Africa to Iberia, which indicates that gene flow from NW Africa to Iberia may have been greater than that in the opposite direction. Other studies, which analyzed either classical genetic markers (Bosch et al. 1997; Kandil et al. 1999; Simoni et al. 1999), a set of up to 21 autosomal STRs (Bosch et al. 2000), or 11 polymorphic Alu insertions (Comas et al. 2000), showed important genetic differences between NW African and Iberian populations. Moreover, Bosch et al. (1997) and Simoni et al. (1999), analyzing, respectively, 13 and 20 populations from all around the Mediterranean basin, found that the sharpest genetic differences were between populations situated on either side of the Strait of Gibraltar. However, beyond the identification of differences in allele frequencies, the use of a system such as high-resolution biallelic-polymorphism Y-chromosome haplotypes, with a well-established gene genealogy and clear geographical structure, allows us to recognize patterns of origin and diffusion of haplotypes, which can then be used to quantify gene flow, as discussed below.

Neither the overall AMOVA nor any pairwise comparison among populations within either NW Africa or Iberia were significantly different from 0, implying that Y-chromosome biallelic haplotypes are highly homogeneous within each geographical region. Classical genetic markers, together with linguistic, paleoanthropological, and archaeological data, point to a Mesolithic (or older) origin of the Basques (Calafell and Bertranpetit 1994). However, this degree of differentiation is not reached by Y-chromosome polymorphisms (Hurles et al. 1999). For further discussion on how different kinds of genetic markers reflect the Basque differentiation, see the report by Comas et al. (2000).


Geographical and Historical Origins of Y-Chromosome Haplotypes in NW Africa and the Iberian Peninsula
Analysis of the worldwide distribution of Y-chromosome haplotypes may help to establish the putative origins of the haplotypes that contributed to the present NW African and Iberian populations. Figure 2 shows the detailed frequencies of haplotypes H22, H35, H36, H38, H58, H71, H102, H103, and H104, for the populations studied, as well as their worldwide distributions. This type of descriptive analysis allows us to recognize the haplotypes either as being autochthonous or as having originated elsewhere (in regions such as sub-Saharan Africa, Europe, or the eastern Mediterranean).
 

Specific founder effect for some NW African haplotypes: an Upper Paleolithic differentiation? Although group III haplotypes H35, H36, and H38 are found in eastern and southern Africa, southern Europe, and the Middle East, their overall frequencies in NW Africa are, by far, the highest reported to date (Semino et al. 2000; Underhill et al. 2000). This is particularly true for H38, which clearly constitutes the male population core of NW Africa. By contrast, haplotype H35 is found mainly in Ethiopia (22.7%) and Sudan (17.5%), and H36 is most frequent among Khoisans (10.3%) and Ethiopians (6.5%) (Underhill et al. 2000). Given that H36 is directly ancestral to H35 and H38 and is found at moderate frequencies in Ethiopia and in southern Africa, this branch of the haplotype phylogeny may have been introduced into NW Africa from eastern Africa. On the other hand, the dramatic discontinuity in frequencies of group III haplotypes (especially H38) that is seen in northern Africa suggests that such differences originated under strong genetic drift in small, isolated populations. Such demographic conditions were probably found only before the population surge brought by the Neolithic, which may have prevented further significant differentiation by drift (Cavalli-Sforza et al. 1994), as shown by computer simulations (Rendine et al. 1986; Calafell and Bertranpetit 1993).

Use of classical genetic markers has suggested (Bosch et al. 1997) that the NW African populations may have a sizeable Upper Paleolithic component. This hypothesized Upper Paleolithic expansion may be represented today by the descendants of the haplotypes that share mutation M35 and that are further characterized by M78 (H35) and M81 (H38). It remains to be resolved whether the latter two haplotypes arose independently from H36 or share a common ancestor, yet to be discovered, that distinguishes them from the remaining haplotypes derived from H36.

Assuming a constant population size, an infinite-sites model, and population subdivision between NW Africa and Iberia, we used Genetree (Griffiths and Tavaré 1994) to estimate the age of M35 (giving H36) to be 53,000±21,000 years ago (ya), that of M78 (giving H35) to be 16,000±10,000 ya, and that of M81 (giving H38) to be 32,000±11,000 ya. Under the more likely condition of population growth (Thomson et al. 2000), the respective estimated ages were 30,000±6,000 ya, 7,600±6,000 ya, and 19,000±4,000 ya. Hence, the expansion that brought the ancestors of H35 and H38 (or even those haplotypes themselves) into NW Africa could have happened at any time after 30,000 ya, and, more specifically, it could have happened during the Upper Paleolithic. However, confidence intervals for those dates are large, even without the uncertainty in the effective population size or in generation time. Thus, any interpretation derived from these dates should be regarded with caution. The lower limit for the differentiation event that brought H35 and H38 to such high frequencies in NW Africa is set by the demographic conditions that are compatible with this magnitude, as discussed above, as well as by the genetic evidence, from classical genetic markers (Bosch et al. 1997), that suggests a strong Paleolithic background in NW Africa.

Haplotypes H35, H36, and H38 were found at a low overall frequency (5%) in the Iberian populations. Eight-locus STR haplotypes for the five Iberian group III chromosomes showed that four of them were identical to group III chromosomes in NW Africans and that the fifth was one STR mutation step away. This is clearly depicted in the reduced median networks in figure 3a and b. Given the fast mutation rate of STRs, the extreme similarity between the STR haplotypes in the two regions can be explained only if Iberian and NW African group III chromosomes have a common origin. The time necessary to accumulate this small number of differences was estimated at 700±600 years. Thus, recent gene flow, rather than common ancestry in the distant past, may have brought those chromosomes from NW Africa into Iberia.
Neolithic Y-chromosome traces in NW Africa and Iberia. H58 and H71(fig. 2e and f) are part of group VI, which is defined by the presence of M89 and by the absence of M9 and subsequently derived mutations. These haplotypes constitute 10% of the Iberian and 13% of the NW African Y chromosomes and are likely to have spread, with the Neolithic expansions, from the Middle East (Semino et al. 2000). Both haplotypes include chromosomes with the derived 12f2-TaqI*8kb allele (Casanova et al. 1985), as confirmed by Bosch et al. (1999) in a subset of the samples in the present study. Y chromosomes bearing that allele have been found all around the Mediterranean basin, with higher frequencies in the Middle East, and have been interpreted to have spread with the Neolithic wave of advance (Semino et al. 1996; Rosser et al. 2000). A steep cline in the frequency of both H58 and H71, with maxima in the Middle East and frequencies declining with geographical distance from the Middle East, is evidence for a diffusion from the Middle East westward through Europe. The presence of H58 and H71 in both regions could be due to two, not necessarily mutually exclusive, historical processes: (1) the parallel, independent advance of the Neolithic expansion from the Middle East, along the northern and southern shores of the Mediterranean, and (2) an early arrival of the Neolithic in either NW Africa or Iberia and the subsequent crossing of the Strait of Gibraltar. Two independent regional analyses of large sets of classical polymorphisms (Bosch et al. 1997; Simoni et al. 1999) found parallel gradients of genetic differentiation, along the northern and southern shores of the Mediterranean, which make the first scenario more likely. In the present study, STR haplotypes for H58 and H71 chromosomes seemed to be associated with the history of their lineages rather than with population history. In a reduced median network (fig. 4), STR haplotypes clustered by lineage, and a main subdivision was linked to an additional biallelic polymorphism, 12f2 (Casanova et al. 1985; data from Bosch et al. 1999 and additional typings reported here), the 8-kb allele of which was found only in some H71 chromosomes and in all H58 chromosomes. Thus, 12f2*8kb seems to have appeared in the phylogeny after M89 but before M172 (fig. 1). Given that the 12f2*8kb allele was found more often in NW Africa than in Iberia, a comparison, between NW Africa and Iberia, of Y-chromosome STR haplotypes would be, in fact, a comparison of different lineages (as seen in fig. 4, where population origin is not random in the main sections of the network) and would confound attempts to differentiate the two scenarios. A confirmation by the Y chromosome would need to establish an independent correlation with distance to the Middle East. Unfortunately, samples from the appropriate populations are not yet available, particularly from countries along the southern shore, such as Libya and Tunisia.
The European Paleolithic background in Iberia. Group IX haplotypes (fig. 2g–i) are found in the Middle East and are most prevalent in Europe (Underhill et al. 2000). Group IX also contains three local Iberian haplotypes: H101, H102, and H103. The latter, which is defined by derived mutation M167 (also known as “SRY-2627”), is equivalent to Y-chromosome haplogroup 22 as described by Hurles et al. (1999). These authors examined haplogroup 22 worldwide and showed that it has a geographical distribution almost restricted to northern Iberia. Moreover, on the basis of the dating of microsatellite and minisatellite diversity within haplogroup 22, they suggested that it arose in Iberia a few thousand years ago.

Group IX is found at a low frequency (3%) in NW Africa. In Iberia, 56% of the Y chromosomes carry H104, which is found across Europe, with increasing frequencies toward the west; its defining mutation, M173, may have been introduced by the first Upper Paleolithic colonizations of Europe (Semino et al. 2000). It may not have been the only lineage introduced into Iberia during the Upper Paleolithic, but it seems to have been the only one that has persisted in the extant Iberian gene pool. Of five H104 NW African chromosomes, one had an STR haplotype identical to that in an H104 Iberian chromosome, one was one mutation step away from Iberian H104 chromosomes, and the remaining three were two mutation steps away. Moreover, the mean repeat-size difference within 53 H104 Iberian STR haplotypes was 2.8 (range 0–11). The phylogenetic relations among H104 STR haplotypes is shown by a reduced median network (fig. 3c), in which the NW African chromosomes appear to be clearly embedded within the Iberian diversity. The time necessary to accumulate the STR-allele differences between NW African and Iberian H104 chromosomes was estimated at 2,100±450 years. This close STR-haplotype similarity seems to indicate that H104 chromosomes found in NW Africa are a subset of the European gene pool and that they may have been introduced during historic times.
Sub-Saharan gene flow into NW Africa. H22 (defined by mutation M2, also referred to, by Seielstad et al. [1994], as “sY81”; see fig. 2a) and H28, which belong to group III, show a sub-Saharan distribution pattern (Seielstad et al. 1994; Hammer et al. 1997; Underhill et al. 2000). The highest frequency of H22 was found in Mali (30%), and the highest frequencies of H28 were found in southern (51%) and central Africa (57%). Both haplotypes together constitute 8% of the NW African Y chromosomes, and, given their geographical distribution, their presence in NW Africa can be interpreted as resulting from sub-Saharan gene flow. The NW African contact with the southern peoples was especially important during the Almoravid Berber expansion (a.d. 1056–1147), which reached as far south as present-day Senegal and Mali (Kasule 1998), and it has been maintained, until recently, by the trans-Saharan commercial routes.

mtDNA control-region sequence analysis (Rando et al. 1998) detected female-mediated gene flow from sub-Saharan Africa to NW Africa. In particular, 21.5% of the mtDNA sequences in a set of different NW African populations were found to belong to haplogroups L1, L2, and L3a, which constitute most of the sub-Saharan mtDNA sequences.

So far, our analyses have allowed a clear dissection of almost all NW African and Iberian paternal lineages into several components with distinct historical origins. In this way, the historical origins of the NW African Y-chromosome pool may be summarized as follows: 75% NW African Upper Paleolithic (H35, H36, and H38), 13% Neolithic (H58 and H71), 4% historic European gene flow (group IX, H50, H52), and 8% recent sub-Saharan African (H22 and H28). In contrast, the origins of the Iberian Y-chromosome pool may be summarized as follows: 5% recent NW African, 78% Upper Paleolithic and later local derivatives (group IX), and 10% Neolithic (H58, H71). No haplotype assumed to have originated in subSaharan Africa was found in our Iberian sample. It should be noted that H58 and H71 are not the only haplotypes present in the Middle East and that the Neolithic wave of advance could have brought other lineages to Iberia and NW Africa. However, the homogeneity of STR haplotypes within the most ancient biallelic haplotypes in each region indicates a single origin during the past, with possible minor reintroductions, with the Neolithic expansion, from the Middle East. Thus, Neolithic contributions may be slightly underestimated.
Detection of Gene Flow across the Gibraltar Strait
The detection of gene flow between both geographical regions may provide a measure of the reciprocal contribution of Y chromosomes that has occurred during the past. In particular, we have shown that Iberian chromosomes carrying H35, H36, and H38 originated in NW Africa and were brought recently to the peninsula. Their frequency in Iberia will allow us to estimate the maximum NW African male contribution to the Iberian Y-chromosome pool. Since not all NW African Y chromosomes carry those haplotypes, gene flow from NW Africa must have brought other chromosomes. Thus, to estimate the NW African contribution, the proportion of H35, H36, and H38 chromosomes in NW Africa must be taken into account. Therefore, we estimated the overall NW African contribution to the Iberian Y-chromosome pool as being 5% (the frequency of H35, H36, and H38 in Iberia) divided by 75% (the frequency of those haplotypes in NW Africa)—that is, 7%, with the highest level of contribution (14%) being found in Andalusians from southern Iberia. Conversely, since group IX chromosomes in NW Africa may have an Iberian origin, the Iberian (or European) contribution to NW Africa can be estimated, as above, as being 4%.
A small NW African genetic contribution in Iberia is also detected with mtDNA, the female counterpart of the Y chromosome. Rando et al. (1998) suggested a NW African–specific origin for mtDNA haplogroup U6, which is found at frequencies of ~10%–20% in NW Africans and is absent or nearly absent in Europeans and other Africans. The presence of this NW African mtDNA haplogroup in Iberia can be used as an indicator of NW African–female contribution. Such a contribution seems to be small, since haplogroup U6 is found at very low frequencies: it has been found in 3 of 54 Portuguese and in 2 of 96 Galicians and is absent in Andalusians and in 162 other Iberians (Bertranpetit et al. 1995; Côrte-Real et al. 1996; Pinto et al. 1996; Salas et al. 1998).

We have detected male-mediated gene flow from NW Africa to the Iberian Peninsula; gene flow in the opposite direction, as shown by the Nm and admixture estimates and by ages obtained from STR haplotypes, occurred at lower levels and is more ancient. However, date estimates integrate all the gene flow between the two regions and should be regarded as giving an average rather than as pinpointing a single event. In that respect, the more ancient age estimate for the north-to-south gene flow could have been caused by the fact that it occurred on a haplotype background, H104, that is slightly more diverse than its south-to-north counterpart, H38 (compare figs. 3c and 3b, respectively), thus carrying a more diverse set of Y chromosomes from Iberia into NW Africa.

The Islamic (Arab and Berber) occupation of the Iberian Peninsula, which began in a.d. 711 and, in the south, lasted until a.d. 1492, left a rich cultural heritage, from science and philosophy to agriculture and architecture. Islamic rule lasted longest, until 1492, in southern Iberia. Our results suggest that the demographic contribution linked to that occupation (and to movements in the opposite direction) must have been small but not at all negligible.

This study has demonstrated the unprecedented power of the use of Y-chromosome biallelic polymorphisms for the dissection of paternal lineages, which has allowed us to cut through the historic layers in the Iberian and NW African gene pools in much the same way as archaeologists excavate prehistoric layers at a site.

The complicated history of Y chromosome E3b…

This seems to confuse a lot of people, me included.

Phylogeographic Analysis of Haplogroup E3b (E-M215) Y Chromosomes Reveals Multiple Migratory Events Within and Out Of Africa

We explored the phylogeography of human Y-chromosomal haplogroup E3b by analyzing 3,401 individuals from five continents. Our data refine the phylogeny of the entire haplogroup, which appears as a collection of lineages with very different evolutionary histories, and reveal signatures of several distinct processes of migrations and/or recurrent gene flow that occurred in Africa and western Eurasia over the past 25,000 years. In Europe, the overall frequency pattern of haplogroup E-M78 does not support the hypothesis of a uniform spread of people from a single parental Near Eastern population. The distribution of E-M81 chromosomes in Africa closely matches the present area of distribution of Berber-speaking populations on the continent, suggesting a close haplogroup–ethnic group parallelism. E-M34 chromosomes were more likely introduced in Ethiopia from the Near East. In conclusion, the present study shows that earlier work based on fewer Y-chromosome markers led to rather simple historical interpretations and highlights the fact that many population-genetic analyses are not robust to a poorly resolved phylogeny.

References  The human Y-chromosome haplogroup E is characterized by the mutations SRY4064, M96, and P29, on a background defined by the insertion of an Alu element (YAP+) (Y Chromosome Consortium 2002; Jobling and Tyler-Smith 2003). Two of the three branches of haplogroup E, the major clades E1 and E2, have been observed almost exclusively on the African continent, where their distribution has been analyzed in detail (Underhill et al. 2000; Cruciani et al. 2002). The third branch, the clade E3, defined by the mutation P2, is the only one that has also been observed in Europe and in western Asia, where it has generally been found at frequencies <25% (Hammer et al. 2000, 2001; Semino et al. 2000; Scozzari et al. 2001; Cinnioğlu et al. 2004).
On the basis of the previously published phylogeny (Y Chromosome Consortium 2002; Jobling and Tyler-Smith 2003), the mutations M2/P1/M180, on the one hand, and M35/M215, on the other, further subdivide E3 in two monophyletic haplogroups: E3a and E3b. Both haplogroups are frequent in Africa (Underhill et al. 2000; Cruciani et al. 2002), although, to date, only E3b has also been observed in Europe (Semino et al. 2000) and western Asia (Underhill et al. 2000; Cinnioğlu et al. 2004). Recently, it has been proposed that E3b originated in sub-Saharan Africa and expanded into the Near East and northern Africa at the end of the Pleistocene (Underhill et al. 2001). E3b lineages would have then been introduced from the Near East into southern Europe by immigrant farmers, during the Neolithic expansion (Hammer et al. 1998; Semino et al. 2000; Underhill et al. 2001).

The three main subclades of haplogroup E3b (E-M78, E-M81, and E-M34) and the paragroup E-M35* are not homogeneously distributed on the African continent: E-M78 has been observed in both northern and eastern Africa, E-M81 is restricted to northern Africa, E-M34 is common only in eastern Africa, and E-M35* is shared by eastern and southern Africans (Cruciani et al. 2002). Given the strong geographic structuring observed for the four subsets of E3b within Africa, it is possible that different E3b lineages also have different frequency profiles in western Eurasia and that the evolutionary events underlying the introduction of E3b chromosomes in this area from Africa were not as simple (Rosser et al. 2000; Richards et al. 2002; Jobling and Tyler-Smith 2003) as previously proposed (Hammer et al. 1998; Semino et al. 2000; Underhill et al. 2001).

In the present study, we address the question of the origin and dispersal of haplogroup E3b subclades within and outside of Africa by analyzing 3,401 individuals from five continents. These include 1,510 individuals analyzed here for the first time for Y-chromosome markers (see also footnotes “b,” “c,” and “d” of table 1).

 All of the subjects were typed for the YAP polymorphism (Hammer and Horai 1995), and those who were YAP+ (haplogroup DE) were analyzed for the SRY4064 (Whitfield et al. 1995), M35, and M215 mutations (Underhill et al. 2000, 2001). Two subjects were found to carry the derived state at M215 and the ancestral state at M35. This modifies the topology of the E3 branch of the tree and the nomenclature of the corresponding haplogroups, as shown in figure 1 (note that “E3b” now refers to all haplogroups with the M215 derived state). Five hundred fifteen haplogroup E3b subjects were identified and further analyzed for the biallelic markers M34, M78, M81, M123, M281 (Underhill et al. 2000; Semino et al. 2002), and V6. The new V6 biallelic marker was discovered in the present survey in the TBL1Y gene by denaturing high-performance liquid chromatography analysis (primer sequences available on request). This marker identifies a subset of chromosomes previously assigned to E-M35* and now classified as “E3b1e” (fig. 1). No individual was found to carry the M281 mutation. We further typed 509 of the 515 E3b subjects for seven GATA STR (A7.1, A7.2, and A10 [White et al. 1999]; DYS19, DYS391, and DYS393 [Roewer et al. 1992, 1996]; and DYS439 [Ayub et al. 2000]) and four CA dinucleotide repeat (YCAIIa, YCAIIb, DYS413a, and DYS413b [Mathias et al. 1994; Malaspina et al. 1997]) polymorphisms. Both tetra- and dinucleotide microsatellites were used to reconstruct haplogroup-specific networks, through use of reduced-median and median-joining procedures (Bandelt et al. 1995, 1999). The seven tetranucleotide repeat polymorphisms were also used for the estimation of the time to the most recent common ancestor (TMRCA) (Goldstein et al. 1995; Slatkin 1995; Thomas et al. 1998) and the time since two populations split from a common ancestor (TD estimator [Zhivotovsky et al. 2004]). For four of the tetranucleotide loci here used, locus-specific mutation rates based on father-son transmissions (μi) are not available (Kayser et al. 2000). Since both TMRCA and TD estimations critically depend on the unknown parameter μi, we used the averaged effective mutation rate described by Zhivotovsky et al. (2004), which is based on a list of markers close to the one used here. CIs for the TMRCA were obtained as described by Scozzari et al. (2001). It should be noted that uncertainties in the mutation rate, in the shape of the genealogy, and in the mutation process would increase the CIs. Since any two chromosomes sampled from two populations have a TMRCA older than the split between populations, and since we considered as null the variance of the ancestral population at the time of its splitting, the figures reported here for the TD estimator represent upper bounds. In all of the analyses, except the networks, the YCAIIa, YCAIIb, DYS413a, and DYS413b dinucleotide repeats were not considered, since univocal assignment of phenotypic patterns to allelic series could not be obtained.

 Figure 1
Phylogenetic tree of haplogroup E3b. Markers typed in this study are in boldface letters. Haplogroups are designated according to the Y Chromosome Consortium (<sup>2002</sup>) and Jobling and Tyler-Smith (<sup>2003</sup>), by subclade and also by mutation (more …)

We obtained an estimate of 25.6 thousand years (ky) (95% CI 24.3–27.4 ky) for the TMRCA of the 509 haplogroup E3b chromosomes, which is close to the 30±6 ky estimate for the age of the M35 mutation reported by Bosch et al. (2001) using a different method. Several observations point to eastern Africa as the homeland for haplogroup E3b—that is, it had (1) the highest number of different E3b clades (table 1), (2) a high frequency of this haplogroup and a high microsatellite diversity, and, finally, (3) the exclusive presence of the undifferentiated E3b* paragroup.

Our data show that haplogroup E3b appears as a collection of subclades with very different evolutionary histories. Haplogroup E-M78 was observed over a wide area, including eastern (21.5%) and northern (18.5%) Africa, the Near East (5.8%), and Europe (7.2%), where it represents by far the most common E3b subhaplogroup. The high frequency of this clade (table 1) and its high microsatellite diversity suggest that it originated in eastern Africa, 23.2 ky ago (95% CI 21.1–25.4 ky). The network of the E-M78 chromosomes reveals a strong geographic structuring, since each of the clusters α, β, and γ (fig. 2B) reaches high frequencies in only one of the regions analyzed. Cluster α is largely characterized by the otherwise rare nine-repeat allele at A7.1 (we found only 3 such alleles out of 800 E[xE3b1] chromosomes analyzed [present study; R.S., unpublished data]), often associated with the uncommon DYS413 24/23 pattern and its one-step neighbors. When compared with the other clusters in the network, it displays marked starlike features, with three central haplotypes accounting for 26% of the entire cluster. This cluster is very common in the Balkans (with frequencies of 20%–32%), and its frequencies decline toward western (7.0% in continental Italy, 7.4% in Sicily, 1.1% in Sardinia, 4.3% in Corsica, 3.0% in France, and 2.2% in Iberia) and northeastern (2.6%) Europe. In the Near East, this cluster is essentially limited to Turkey (3.4%). The relatively high frequency of DYS413 24/23 haplogroup E chromosomes in Greece (A.N., unpublished data) suggests that cluster α of the E-M78 haplogroup is common in the Aegean area, too.

 Figure 2
Microsatellite networks of E3b haplogroups. A, E-M35*. B, E-M78. C, E-M81. D, E-M34. Reduced-median and median-joining procedures (Bandelt et al. <sup>1995</sup>, <sup>1999</sup>) were applied sequentially. A haplogroup-specific weight proportional to (more …)

Cluster β, characterized by the DYS413 23/21 pattern and the rare 10-repeat allele at DYS439, is common in northwestern Africa (14.0%), representing 80% of E-M78 chromosomes in that area. Outside this region, E-M78β was observed only in five European subjects.

All of the chromosomes in cluster γ (fig. 2B) are identified by the rare short 11-repeat allele at the DYS19 STR locus. We did not find this allele in >2,000 Y(xE-M78) chromosomes analyzed (present study; R.S., unpublished data), and it is reported in only 9 of 13,447 subjects analyzed for this marker in the European Y-STR reference database (Y-STR Haplotype Reference Database Web site). The cluster E-M78γ was found in eastern Africa at an average frequency of 17.7%, with the highest frequencies in the three Cushitic-speaking groups: the Borana from Kenya (71.4%), the Oromo from Ethiopia (32.0%), and the Somali (52.2%). Outside of eastern Africa, it was found only in two subjects from Egypt (3.6%) and in one Arab from Morocco.

The fourth cluster (cluster δ in fig. 2B) is present, albeit at low frequencies, in all of the regions analyzed (4.0% in eastern and northern Africa, 3.3% in the Near East, and 1.5% in Europe) and shows a notable microsatellite differentiation (fig. 2B). The two E-M78 chromosomes found in Pakistan, at the eastern borders of the area of dispersal of haplogroup E3b, also belong to cluster δ. On the basis of these data, we suggest that cluster δ was involved in a first dispersal or dispersals of E-M78 chromosomes from eastern Africa into northern Africa and the Near East. Time-of-divergence estimates for E-M78δ chromosomes suggest a relatively great antiquity (14.7±2.7 ky) for the separation of eastern Africans from the other populations. A later range expansion from the Near East or, possibly, from northern Africa would have introduced E-M78 cluster δ into Europe. However, given the low frequencies of E-M78δ, it seems to have contributed only marginally to the shaping of the present E-M78 frequency distribution in Africa and western Eurasia. Indeed, later (and previously undetected) demographic population expansions involving clusters α in Europe (TMRCA 7.8 ky; 95% CI 6.3–9.2 ky), β in northwestern Africa (5.2 ky; 95% CI 3.2–7.5 ky), and γ in eastern Africa (9.6 ky; 95% CI 7.2–12.9 ky) should be considered the main contributors to the relatively high frequency of haplogroup E-M78 in the surveyed area.

The present distributions of these clusters also suggest episodes of range expansions. Although E-M78β and E-M78γ show only modest levels of gene flow (from northern Africa to Europe and from eastern to northern Africa, respectively), the clinal frequency distribution of E-M78α within Europe testifies to important dispersal(s), most likely Neolithic or post-Neolithic. These took place from the Balkans, where the highest frequencies are observed, in all directions, as far as Iberia to the west and, most likely, also to Turkey to the southeast. Thus, it appears that, in Europe, the overall frequency pattern of the haplogroup E-M78, the most frequent E3b haplogroup in this region, is mostly contributed by a new molecular type that distinguishes it from the aboriginal E3b chromosomes from the Near East. These data are hard to reconcile with the hypothesis of a uniform spread of a single Near Eastern gene pool into southeastern Europe. On the other hand, they might be consistent with either a small-scale leapfrog migration from Anatolia into southeastern Europe at the beginning of the Neolithic or with an expansion of indigenous people in southeastern Europe in response to the arrival of the Neolithic cultural package. At the present level of phylogenetic resolution, it is difficult to distinguish between these possibilities.

E-M81 is very common in northwestern Africa, with frequencies as high as 80% (Bosch et al. 2001; Cruciani et al. 2002; present study), but its frequency sharply declines on the continent toward the east, and the haplogroup is not found in sub-Saharan Africa. The distribution of E-M81 chromosomes in Africa closely matches the present area of distribution of Berber-speaking populations on the continent, suggesting a close haplogroup–ethnic group parallelism: in northwestern Africa, the lowest frequencies for this haplogroup have been reported in two Arab-speaking Moroccan populations (31% and 52% vs. 65%–80% in six Berber speaking groups from Morocco and Algeria [Bosch et al. 2001; Cruciani et al. 2002; present study]); in Egypt, where Berbers are restricted to a few villages, E-M81 is rare (1.9%), and the southernmost finding of E-M81 chromosomes on the continent is that here reported in the Tuareg from Niger (9.1%), who also speak a Berber language. Outside of Africa, E-M81 has been observed in all the six Iberian populations surveyed, with frequencies in the range of 1.6%–4.0% in northern Portuguese, southern Spaniards, Asturians, and Basques; 12.2% in southern Portuguese; and 41.1% in the Pasiegos from Cantabria. It has been suggested (Bosch et al. 2001) that recent gene flow may have brought E3b chromosomes from northwestern Africa into Iberia, as a consequence of the Islamic occupation of the peninsula, and that such gene flow left only a minor contribution to the current Iberian Y-chromosome pool. The relatively young TMRCA of 5.6 ky (95% CI 4.6–6.3 ky) that we estimated for haplogroup E-M81 and the lack of differentiation between European and African haplotypes in the network of E-M81 (fig. 2C) support the hypothesis of recent gene flow between northwestern Africa and Iberia. In this context, our data refine the conclusions of Bosch et al. (2001) in two ways. First, not all of the E3b chromosomes in Iberia can be regarded as a signature of African gene flow into the peninsula: in our data set, 8 of 15 E-M78 chromosomes belong to cluster α, denoting gene flow from mainland Europe (see above). Second, and more importantly, the degree of the African contribution is highly variable across different Iberian populations: the proportion of haplogroup E chromosomes of African origin (E[xE3b], E-M35*, and E-M81) was <5% in three Spanish locations; 10.0% and 14.2% in northern and southern Portugal, respectively; and >40% in the Pasiegos (table 1). A relatively high frequency of E-M81 in a different sample of Pasiegos (18%) and non-Pasiegos Cantabrians (17%) has also recently been reported (Maca-Meyer et al. 2003). Such differences in the relative African contribution to the male gene pool of different Iberian populations may reflect, at least in part, the different durations of Islamic influence and introgression in different parts of the peninsula, as well as drift/founder effects for the small Pasiegos group.

The E-M123 clade was found in Ethiopia (11.2%), the Near East (3.7%), Europe (1.7%), and northern Africa (0.9%). In our data set, all the E-M123 chromosomes also carry the M34 mutation (E-M34), with the exception of one E-M123* subject from Bulgaria. This paragroup has been previously reported only in one individual from Central Asia (Underhill et al. 2000). Although the frequency distribution of E-M34 could suggest that eastern Africa was the place in which the haplogroup arose, two observations point to a Near Eastern origin: (1) Within eastern Africa, the haplogroup appears to be restricted to Ethiopia, since it has not been observed in either neighboring Somalia or Kenya (present study) or Sudan (Underhill et al. 2000). By contrast, E-M34 chromosomes have been found in a large majority of the populations from the Near East so far analyzed (Underhill et al. 2000; Cinnioğlu et al. 2004; Semino et al. 2004 [in this issue]; present study). (2) E-M34 chromosomes from Ethiopia show lower variances than those from the Near East and appear closely related in the E-M34 network (fig. 2D). If our interpretation is correct, E-M34 chromosomes could have been introduced into Ethiopia from the Near East. The high frequency of E-M34 observed for some of the Ethiopian populations could be the consequence of subsequent genetic drift, which can also explain the lower frequencies (2.3% [Underhill et al. 2000] and 4.0% [Semino et al. 2002]) reported for two large independent samples of Ethiopians. From the Near East, E-M34 chromosomes could also have been introduced into Europe, possibly by Neolithic farmers, but the paucity of E-M34 chromosomes in southeastern Europe (Semino et al. 2004 [in this issue]; present study) weakens this hypothesis. Indeed, as for E-M78δ chromosomes, introduction of E-M34 from Africa directly to southern-central Europe cannot be excluded at the present.

Haplogroup E-V6 was observed only in eastern Africa (8.9% in Ethiopia, with a single occurrence in both Somalia and Kenya), further testifying to the richness of E3b lineages in this region. Although no clear inferences can be drawn on the basis of the current E-V6 frequency distribution data, the V6 polymorphism may prove to be a useful marker for future microevolutionary studies in eastern Africa.

The paragroup E-M35* has been observed at high frequencies in both eastern (10.5%) and southern (15.2%) Africa, with rare occurrences in northern Africa and Europe (0.4% and 0.5%, respectively). The paragroup has a high microsatellite allele variance (0.63), comparable to that of the whole set of E3b(xE3b1*) chromosomes (0.53), suggesting that E-M35* is a collection of several lineages whose relationships to other E3b haplogroups remain to be established. Nevertheless, the observed distribution of E-M35* can shed light on the history of peopling of Africa. For example, we found E-M35* and E-M78 chromosomes in Bantu-speaking populations from Kenya (14.3%) but not in those living in central Africa (Cruciani et al. 2002), the area in which the Bantu expansion originated (Vansina 1984). In agreement with mtDNA data (Salas et al. 2002), this finding suggests a relevant contribution of eastern African peoples to the gene pool of the eastern Bantu. Also, the extensive interpopulation E-M35* microsatellite diversity (fig. 2A) between Ethiopians and Khoisan indicates that eastern Africans and Khoisan have been separated for a considerable period of time, as has been suggested elsewhere (Scozzari et al. 1999; Cruciani et al. 2002; Semino et al. 2002).

In conclusion, we detected the signatures of several distinct processes of migration and/or recurrent gene flow associated with the dispersal of haplogroup E3b lineages. Early events involved the dispersal of E-M78δ chromosomes from eastern Africa into and out of Africa, as well as the introduction of the E-M34 subclade into Africa from the Near East. Later events involved short-range migrations within Africa (E-M78γ and E-V6) and from northern Africa into Europe (E-M81 and E-M78β), as well as an important range expansion from the Balkans to western and southern-central Europe (E-M78α). This latter expansion was the main contributor to the present distribution of E3b chromosomes in Europe.


So.. E3b1 went both up and down the Nile, mutated, and went all sorts of directions. In a nutshell. I’d just like to comment, that E3b1 is so widely spread it has no racial affilitations, being found all over Caucasian Southern Europe and Caucasian North Africa, as well as in Ethiopia and the near East. Anyone using E3b1 to claim ‘black african’ ancestry needs to..

  • Find out which clade it is.
  • Do some reading on the Berbers if it’s E3b1b (M78). Berbers aren’t usually black, and are mostly of Caucasian ancestry, going back about 20,000 years.
  • Do some reading on the spread of Y chromosomes in the Neolithic.

All the links you’ll never need on E3b.

My own page..

http://www.pubmedcentral.nih.gov/articlerender.fcgi?artid=1216069
http://www.ajhg.org/AJHG/abstract/S0002-9297(07)64365-1
http://www3.interscience.wiley.com/homepages/38515/pdf/916.pdf
http://mbe.oxfordjournals.org/cgi/content/abstract/24/6/1300
http://www.ajhg.org/AJHG/abstract/S0002-9297(07)61870-9
http://www.pubmedcentral.nih.gov/articlerender.fcgi?artid=1181965
http://findarticles.com/p/articles/mi_qa3659/is_200606/ai_n17175647
http://www.nature.com/ejhg/journal/v12/n2/full/5201075a.html
http://dienekes.50webs.com/blog/archives/000531.html

Eurasian Origins of Berbers and modern North Africans.

Eurasian Origin of Berbers and modern North Africans

Essentially the same thing, as North Africans are mainly Arabized Berbers..

Essentially, about ten thousand years ago a population wave from the near East swept over North Africa, bringing in gracile Mediterranean people in the Capsian era. A later wave of immigration occurred in the Neolithic when the expanding farmers from the near east ploughed their way across North Africa, some leaving artwork in the central Sahara to mark their passage. As far as DNA studies can tell, the Arab invasions that converted North Africans to Islam made virtually no impact to the population; essentially they converted the local population and didn’t replace them. There was a only trace contribution made to North Africa by Europe during the Barbary slavery era, but quite a significant amount of sub Saharan maternal ancestry was added. The modern North African is mainly Eurasian in ancestry, and cluster with Europeans and west Asians. To quote Cavalli Sforza..

Berbers are located primarily in the northern regions of Algeria and Morocco, but somewhat to the interior, usually not far from the sea. . Berbers are believed to have their ancestors among Capsian Mesolithics and their Neolithic descendants, possibly with genetic contributions from the important Neolithic migrations from the Near East. It is reasonable to hypothesize that the Berber (Afro-Asiatic) language was introduced by the Neolithic farmers

Anyway, this page has a few links to DNA studies of North Africans, which I should really start updating. I’s not complete. One day I will redo the whole thing to be neater and more comprehensive.

Sean Myles1, 2 , Nourdine Bouzekri1, Eden Haverfield1, 3, Mohamed Cherkaoui4, Jean-Michel Dugoujon5 and Ryk Ward1

(1)  Institute of Biological Anthropology, University of Oxford, Oxford, UK
(2)  Department of Evolutionary Genetics, Max-Planck Institute for Evolutionary Anthropology, Deutscher Platz 6, 04103, Leipzig, Germany
(3)  Department of Human Genetics, University of Chicago, 920 East 58th Street, Chicago, IL 60637, USA
(4)  Laboratoire dEcologie Humaine, Faculté des Sciences-Semlalia, Université Cadi Ayyad, Morocco
(5)  Centre dAnthropologie CNRS,, University of Toulouse, UMR 8555, France

Received: 15 November 2004  Accepted: 23 December 2004  Published online: 2 April 2005

Abstract  The process by which pastoralism and agriculture spread from the Fertile Crescent over the past 10,000 years has been the subject of intense investigation by geneticists, linguists and archaeologists. However, no consensus has been reached as to whether this Neolithic transition is best characterized by a demicdiffusion (witha significant genetic input from migrating farmers) or a culturaldiffusion (without substantialmigration of farmers). Milk consumption and thus lactose tolerance are assumed to have spread with pastoralism and we propose that by looking at the relevant mutations in and around the lactase gene in human populations, we can gain insight into the origin(s) and spread of dairying. We genotypedthe putatively causal allele for lactose tolerance (–13910T) and constructed haplotypes from several polymorphisms in and around the lactase gene (LCT) in three NorthAfrican Berber populations and compared our results with previously published data. We found that the frequency of the –13910T allele predicts the frequency of lactose tolerance in several Eurasian and North African Berber populations but not in most sub-Saharan African populations. Our analyses suggest that contemporary Berber populations possess the genetic signature of a past migration of pastoralistsfrom the Middle East and that they share a dairying origin withEuropeans and Asians, but not with sub-Saharan Africans.
Mitochondrial DNA heterogeneity in Tunisian Berbers
Berbers live in groups scattered across NorthAfrica whose origins and genetic relationships with their neighbours are not well established. The first hypervariablesegment of the mitochondrial DNA (mtDNA) control region was sequenced in a total of 155 individuals from three Tunisian Berber groups and compared to other North Africans. The mtDNA lineages found belong to a common set of mtDNA haplogroups already described in NorthAfrica. Besides the autochthonous North African U6 haplogroup, a group of L3 lineages characterized by the transition at position 16041 seems to be restricted to North Africans, suggesting that an expansion of this group of lineages took place around 10500 years ago in NorthAfrica, and spread to neighbouring populations. Principal components and the coordinate analyses show that some Berber groups (the Tuareg, the Mozabite, and the Chenini-Douiret) are outliers within the NorthAfrican genetic landscape. This outlier position is consistent with an isolation process followed by genetic drift in haplotypefrequencies, and with the high heterogeneity displayed by Berbers compared to Arab samples as shown in the AMOVA. Despite this Berber heterogeneity, no significant differences were found between Berber and Arab samples, suggesting that the Arabization was mainly a cultural process rather than a demographic replacement.

Genetic studies have emphasized the contrast between North African and sub-Saharan populations, but the particular affinities of the North African mtDNA pool to that of Europe, the Near East, and sub-Saharan Africa have not previously been investigated. We have analysed 268 mtDNA control-region sequences from various Northwest African populations including severalSenegalese groups and compared these with the mtDNAdatabase. We have identified a few mitochondrial motifs that are geographically specific and likely predate the distribution and diversification of modern language families in North and West Africa. A certain mtDNA motif (16172C, 16219G), previously found in Algerian Berbers at high frequency, is apparently omnipresent in Northwest Africa and may reflect regional continuity of more than 20,000 years. The majority of the maternal ancestors of the Berbers must have come from Europe and the Near East since the Neolithic.The Mauritanians and West-Saharans, in contrast, bear substantial though not dominant mtDNAaffinity with sub-Saharans.

This is actually a bit innacurate, as the approximate arrivalof a lot of the Eurasian DNA , excluding U, coincides withthe Neolithic expansion and arrival of the Capsian culture about 10,000 years ago (from Cranio facial studies of ancient Magrebian skulls). The Capsians show a gracile build and small face traceable to the eastern Mediterranean.

The faces of modern North Africa.

Abstract  Alu elements are the largest family of short tandem interspersed elements (SINEs) in human who have arisen to a copy number with an excess of 500 000 copies per haploid human genome and mobilize through an RNAse polymerase III derived transcript in a process termed retroposition. Several features make Alu insertions a powerful tool used in population genetic studies: the polymorphic nature of many Alu insertions, the stability of an Aluinsertion event and, furthermore, the ancestral state of an Alu insertion is known to be the absence (complete and exact) of the Alu element at a particular locus and the presence of an Alu insertion at the site that forward mutational change. Here we report on the distribution of six polymorphic Aluinsertions in a generalMoroccan population and in the Arab and Berber populations from Morocco and their relationships with other populations previously studied. Our results show that there is a small difference between Arabs and Berbers and that the Arab population was closer to African populations than Berber population which is closest to Europeans.

Mitochondrial DNA transit between West Asia and North Africa inferred from U6 phylogeography


Nicole Maca-Meyer1 , Ana M González1 , José Pestano2 , Carlos Flores1 , José M Larruga1  and Vicente M Cabrera1

Published: 16 October 2003

Abstract
World-wide phylogeographicdistribution of human complete mitochondrial DNA sequences suggested a West Asian origin for the autochthonous North African lineage U6. We report here a more detailed analysis of this lineage, unraveling successive expansions that affected not only Africa but neighboring regions such as the Near East, the Iberian Peninsula and the Canary Islands.

Results
Divergence times, geographic origin and expansions of the U6 mitochondrial DNA clade, have been deduced from the analysis of 14 complete U6 sequences, and 56 different haplotypes, characterized by hypervariable segment sequences and RFLPs.

Conclusions
The most probable origin of the proto-U6 lineage was the Near East. Around 30,000 years ago it spread to North Africa where it represents a signature of regional continuity
. Subgroup U6a reflects the first African expansion from the Maghrib returning to the east in Paleolithic times. Derivative clade U6a1 signals a posterior movement from East Africa back to the Maghriband the Near East. This migration coincides with the probable Afroasiatic linguistic expansion. U6b and U6c clades, restricted to West Africa, had more localized expansions. U6b probably reached the Iberian Peninsula during the Capsian diffusion in North Africa. Two autochthonous derivatives of these clades(U6b1 and U6c1) indicate the arrival of North African settlers to the Canarian Archipelago in prehistoric times, most probably due to the Saharan desiccation. The absence of these Canarian lineages nowadays in Africa suggests important demographic movements in the western area of this Continent.

The Emerging Tree of West Eurasian mtDNAs: A Synthesis of Control-Region Sequences and RFLPs

 Variation in the human mitochondrial genome (mtDNA) is now routinely described and used to infer the histories of peoples, by means of one of two procedures, namely, the assaying of RFLPsthroughout the genome and the sequencing of parts of the control region (CR). Using 95 samples from the Near East and northwest Caucasus, we present an analysis based on both systems, demonstrate their concordance, and, using additional available information, present the most refined phylogeny to date of west Eurasian mtDNA. We describe and apply a nomenclaturefor mtDNA clusters. Hypervariable nucleotides are identified, and the relative mutation rates ofthe two systems are evaluated. We point out where ambiguities remain. The identification of signature mutations for each cluster leads us to apply a hierarchical scheme for determining the cluster composition of a sample of Berber speakers, previously analyzed only for CR variation. We show that the main indigenous North African cluster is a sister group to the most ancient cluster of European mtDNAs, from which it diverged »50,000 years ago.

MtDNA Profile of West Africa Guineans: Towards a Better Understanding of the Senegambia Region

Alexandra Rosa et al.

The matrilineal genetic composition of 372 samples from the Republic of Guiné-Bissau (West African coast) was studied using RFLPsand partial sequencing of the mtDNA control and coding region. The majority of the mtDNA lineages of Guineans (94%) belong to West African specific sub-clusters of L0-L3 haplogroups. A new L3 sub-cluster (L3h) that is found in both eastern and western Africa is present at moderately low frequencies in Guinean populations.A non-random distribution of haplogroups U5 in the Fula group, the U6 among the “Brame” linguistic family and M1 in the Balanta-Djola group, suggests a correlation between the genetic and linguistic affiliation of Guinean populations. The presence of M1 in Balanta populations supports the earlier suggestion of their Sudanese origin. Haplogroups U5 and U6, on the other hand, were found to be restricted to populations that are thought to represent the descendants of a southern expansion of Berbers.Particular haplotypes, found almost exclusively in East-African populations, were found in some ethnic groups with an oral tradition claiming Sudanese origin.

A possible ancient migration from Asia to Africa was proposed by Cruciani et al. (2002) to explain the presence of some unusual Y-chromosome lineages identified in West Africa. Haplogroup R1 (defined by M173 mutation), without further branch defining mutations (M269 and M17) specific to Europeans, accounted for ~40% of the Y-chromosomes in North-Cameroon, while not yethaving been sampled elsewhere in Africa. More data from Central and Western Africa are needed to cast light on the origin of such idiosyncratic mtDNA and Y chromosome lineages. Thus, our U5 sequences from the Guinean Fulbe people corroborate Cruciani’s hypothesis of a prehistoric migration from Eurasia to West Sub-Saharan Africa, testified by their present day restricted and localised distribution

Alu insertion polymorphisms in NW Africa and the Iberian Peninsula: evidence for a strong genetic boundary through the Gibraltar Straits

Abstract An analysis of 11 Alu insertion polymorphisms (ACE, TPA25, PV92, APO, FXIIIB, D1, A25, B65, HS2.43, HS3.23, and HS4.65) has been performed in several NW African (Northern, Western, and Southeastern Moroccans; Saharawi; Algerians; Tunisians) and Iberian (Basques, Catalans, and Andalusians) populations. Genetic distances and principal component analyses show a clear differentiation of NW African and Iberian groups of samples, suggesting a strong genetic barrier matching the geographical Mediterranean Sea barrier. The restriction to gene flow may be attributed to the navigationalhazards across the Straits, but cultural factors must also have played a role. Some degree of gene flow from sub-Saharan Africa can be detected in the southern part of North Africa and in Saharawi and Southeastern Moroccans, as a result of a continuous gene flow across the Sahara desert that has created a south-north cline of sub-Saharan Africa influence in North Africa. Iberian samples show a substantial degree of homogeneity and fall within the cluster of European-based genetic diversity.

The population history of North Africa is particularly interesting because, although the region belongs to continental Africa, its history has been completely different from the sub-Saharan part. The peopling of the region has been influenced by two strong geographical barriers: the Sahara Desert to the south, which splits the African continent into two differentiated regions, and the Mediterranean Sea to the north, which separates the European and African continents. These geographical barriers may have constrained human movements in NorthAfrica into an east-west gradient, although they were not impermeable to human movements. During the first half of the Holocene, the humid climate that prevailed in the Sahara produced a receding of the desert allowing human settlements, but over the past 5000 years, the Sahara Desert has suffered a gradual aridification and has become as dry as it is nowadays (Said and Faure 1990). Historicalrecords document extensive trade routes that were established across the desert between sub-Saharan Africa and the north coast. In contrast, since the time of the Phoenicians, the city-based settlement pattern of the NW African coast integrated the area into the Mediterranean world. The seaward orientation of populations persisted and, similar to the desert, separated the Maghreb (NW Africa) from the rest of Africa to the south (Newman 1995). Moreover, during the 8th century AD, Berbers from North Morocco and Algeria under Arab leadership crossed the Mediterranean Sea and occupied the Iberian Peninsula for almost eight centuries, although the demographic impact of the conquest is thought to be limited (Hitti 1990).

Until recently, few genetic studies have been performed in NW Africa. In the latest compilation of classical genetic markers in North Africa (Bosch et al. 1997), the first principal component (PC) of gene frequencies showed an east-west pattern of genetic differentiation, in agreement with the geographical barrier imposed by the Sahara and the Mediterranean. Recent work with autosomal short tandem repeats (STRs; Bosch et al. 2000), mitochondrial DNA (mtDNA) sequences (Rando et al. 1998), and Y-chromosome haplotypes (Bosch et al. 1999) has suggested that the gene flow between NW Africa and Iberia and that between sub-Saharan Africa and NW Africa has been small. MtDNA variation in NW Africa (Rando et al. 1998) has shown a high frequency (up to 25%) of geographically specific sequences (named haplogroup U6) that is essentially absent in the Iberian Peninsula (from 0% in Andalusians to 5% in Portuguese). The mtDNA analysis has shown a limited gene flow from Europe to NW Africa that could be attributed to recent human movements.The study of Y-chromosome haplotypes (Bosch et al. 1999) shows little admixture between NW Africa and the Iberian Peninsula. The study of 21 autosomal STR loci in NW Africa has also shown a clear genetic difference between NW African populations and Iberians, although some degree of gene flow into Southern Iberia (Andalusians) can be detected (Bosch et al. 2000).

Diversité mitochondriale de la population de Taforalt (12.000 ans bp – maroc): une approche génétique a l’étude du peuplement de l’afrique du nord.

(Mitochondrial diversity in the Taforalt population (circa 12,000 BP, Morocco): a genetic approach to the study of the peopling of North Africa.)

  ABSTRACT: 

The population exhumed from the archaeological site of Taforalt in Morocco (12,000 years BP) is a valuable source of information toward a better knowledge of the settlement of Northern Africa region and provides a revolutionary way to specify the origin of Ibero-Maurusian populations. Ancient DNA was extracted from 31 bone remains from Taforalt.The HVS1 fragment of the mitochondrial DNA control region was PCR-amplified and directly sequenced. Mitochondrial diversity in Taforalt shows the absence of sub-Saharan haplogroups suggesting that Ibero-Maurusian individuals had not originated in sub-Saharan region.Our results reveal a probable local evolution of Taforalt population and a genetic continuity in North Africa.

Eurasiatic component  (J/T, H, U et V) and North African component (U6).

Genetic structure of Taforalt:

Eurasiatic Component :   H, U, JT, V:  90.5%

North African component: U6: 9.5 %

42, 8% (9/21)           H or U
14, 2% (3/21)            JT
2 individuals (9,5%)  U6

Essentially, the DNA studies of Berbers observe that they are mostly similar to Eurasians, and that they appear to have arrived in North Africa about 30,000 years ago plus (Mechta Afaloupeople), with a second wave of colonisation in the neolithic from the Near East confirmed by the cranio facial measurements (Loring Brace) of neolithic North Africans. Then then migrated South during the saharan wetphase about 12,000 years ago, with Eurasian Y chromosome now making up 40% of Cameroon’s Y chromosomes as a result (although less in other areas).

All these prehistoric NorthAfricans are described as mostly similar to other Mediterranean Caucasian populations, with a lesser similarity to Nubians from the Wadi Halfa area. There’s a simplified explanation of ancient North African population movements here

Edit to Blog..

To the mad Afrocentrist ‘Nubian’ who claims that these DNA studies prove Berbers are all black and that the white Berbers are the descendants of slaves…

Please show where any of these studies say that.. Because they don’t, at all. They point out that Berbers are mostly Caucasian and that they’ve been in North Africa a very long time.

Explain why every anthropologist who’s looked at Mahgrebian bones in the Holocene describes them as mainly Caucasian Mediterranean.

Explain why the Egyptians uniformly portrayed Libyans as white Caucasians, as they North Africans did on their own art work.

Explain why all the contemporary art and descriptions of the Moors  all show a majority Caucasian population.

Why the Guanches, an isolated North African group since the BC’s were all white people with plentiful blondes, if all Berbers were black untill ‘Moorish slavery whitened up North Africa’?

Also, for those who insist in the face of overwhelming evidence they were all black in North Africa until European slaves whitened them up..

From the Roman era in Libya. All the Roman era mosaics show a mainly Caucasoid light skinned population in North Africa, as does the rock art.

Carthage era coins, with two coins showing Hannibal.

The Tassili ladies, from Algeria (age unclear, but sometime in the BC). I have a wider collection of  images here.

I also have a 16th century image of the contemporary Guanches; pure blood North Africans with no European or sub Saharan ancestry mixed in, isolated on the Canary islands since about 500 BC, alone for about 1,000 years until the Spanish invaded.

In the brown skin clothing. As you can see he is pretty indistinguishable from the Spaniard holding him.

I would also like to point out that the Tuareg at not ‘the only real Berbers’ as is often claimed. In fact, they are related to the Beja, and are relatively recent arrivals in North West Africa who have adopted Berber customs. They are also about half Eurasian in ancestry. The recent contribution of Europeans to the North African genepool is 4% for males, and probably less than 2% for females; 12,000 year old DNA studies show only Eurasian derived mt DNA in ancient North Africans from Morocco. It isn’t likely to be very high though, as the majority of Barbary slaves were males. A good comparison would be the Arabian peninsula. About 8 million or so slaves were imported from Eaest Africa into this area, but only about 10% of the Mt DNA there is African. By contrast about 1.25 million Europeans ended up on the Barbary coast, so this is unlikely to have made a difference of more than a couple of percent to the whole. Way more black African slaves were imported into the area during the Barbary slavery era, so the net difference is probably that they are slightly darker than they used to be.

I’d also like to point out to those who feel the need to spam me with descriptions of Berbers as black or brown from old European texts…

Europeans used these words differently back then. Brown was used to describe anyone with a moderate tan, black was a skin tone of a dark tan seen with black hair and dark eyes. Ladies and children had white skin. Europeans commonly called anyone with black hair and a heavy tan black, so believing that black in medieval/renaissance literature refers to a black African is incorrect. In fact, you can find references to Jews, Turks and Spaniards as being black. Gypsies were still referred to as black into the 20th century. See below. Black Africans are referred to as Ethiopians in these old texts.

The men were very black, with their hair frizzled, the women were the most ugly and the blackest that were ever seen. .. they had sorceresses amongst them , who by pretended to look into peoples hands, to tell them what had or would happen to them…” p. 153 of The Christian journal and Literary Reigster published I 1827 by T & J. Swords? Photo Arabian gypsies , European gypsies James Michener’s Iberia Spanish Travels and Reflections 1968.

18?? – “We were not far from Pressburg when at once we heard in the distance, a singing, shouting and hallooing which continually grew nearer. Presently we met four wagons, in which a brown company of gypsies were seated. It was a curious sight. Their sat men and women, girls and boys all dark as half-negroes, in ragged array, with long shining hair, smeared after Hungarian fashion with lard…We gazed at them in astonishment…” Wanderings of a Journeyman Tailor through Europe and the East: During the years 1824 to 184

COMMENTS POLICY.

Unfortunately necessary, as Afrocentrists feel the need to spam this page with moronic comments. All comments need to be approved by me before they’ll appear. They won’t be posted unless…

  • They are an intelligent comment
  • I’m in a bad mood and feel like ridiculing someone (Dana/Don).

I’d also like to point out that NOT ONE SINGLE ANTHROPOLOGIST takes the view that there’s been any kind of population change in North Africa since the Neolithic. Take that as a hint.

Neolithic Origin for Y-Chromosomal Variation in North Africa.

Barbara Arredi,1,2,3 Estella S. Poloni,3 Silvia Paracchini,2,* Tatiana Zerjal,2 Dahmani M. Fathallah,4 Mohamed Makrelouf,5 Vincenzo L. Pascali,1 Andrea Novelletto,6 and Chris Tyler-Smith2,7Am J Hum Genet. 2004

We have typed 275 men from five populations in Algeria, Tunisia, and Egypt with a set of 119 binary markers and 15 microsatellites from the Y chromosome, and we have analyzed the results together with published data from Moroccan populations. North African Y-chromosomal diversity is geographically structured and fits the pattern expected under an isolation-by-distance model. Autocorrelation analyses reveal an east-west cline of genetic variation that extends into the Middle East and is compatible with a hypothesis of demic expansion. This expansion must have involved relatively small numbers of Y chromosomes to account for the reduction in gene diversity towards the West that accompanied the frequency increase of Y haplogroup E3b2, but gene flow must have been maintained to explain the observed pattern of isolation-by-distance. Since the estimates of the times to the most recent common ancestor (TMRCAs) of the most common haplogroups are quite recent, we suggest that the North African pattern of Y-chromosomal variation is largely of Neolithic origin. Thus, we propose that the Neolithic transition in this part of the world was accompanied by demic diffusion of Afro-Asiatic–speaking pastoralists from the Middle East.

Many studies of African genetic diversity have concentrated on sub-Saharan and northeastern Africa, the most likely source region and corridor to the rest of the world (Tishkoff and Williams 2002). North Africa, however, may have followed a distinct evolutionary direction and requires further investigation. Genetic studies of this area, performed using classical markers, have revealed an agreement between genetic and geographic distances (Cavalli-Sforza et al. 1994) and a predominantly east-west structure to the genetic variation (Bosch et al. 1997). A compilation of 185 mtDNAs sampled across North Africa showed (1) that about half of the lineages belonged to the L haplogroups otherwise observed mainly in sub-Saharan Africa and (2) that most of the rest fell into haplogroup U6 (Salas et al. 2002), which perhaps originated in the Near East and spread into North Africa ~30 thousand years (KY) ago (KYA) (Maca-Meyer et al. 2003). Y-chromosomal studies are potentially highly informative about the origin of male-specific lineages, because of the detailed haplotypes that can be obtained and their high geographical specificity (Jobling and Tyler-Smith 2003), but previous studies have been restricted to limited regions of North Africa (Bosch et al. 1999, 2001; Flores et al. 2001; Manni et al. 2002; Luis et al. 2004). Together, these genetic analyses highlighted the similarity between northeastern Africa and the Middle East and the clear genetic differentiation between northwestern Africa and both sub-Saharan Africa and Europe, including Iberia. The Sahara and Mediterranean, despite the narrow width of the Strait of Gibraltar, seem to have acted as effective long-term barriers to Y-chromosomal gene flow.
To provide a more complete description of the North African pattern of Y-chromosomal variation, we have analyzed five additional populations: Algerian Arabs, Algerian Berbers, Tunisians, and North and South Egyptians (table 1). Binary polymorphisms (Underhill et al. 2000), including 12f2 (Casanova et al. 1985), were typed in the hierarchical fashion described elsewhere (Rosser et al. 2000; Paracchini et al. 2002), allowing the allelic states at 119 markers defining 117 haplogroups to be measured or inferred from the Y phylogeny (fig. 1A). In the North African sample, 30 binary markers were found to be polymorphic, identifying 23 different haplogroups (fig. 1A) (table A1 [online only]). Phylogenetically related haplogroups were classified into clusters, the frequencies of which are shown schematically in fig. 1B. With the existing data from Morocco (Bosch et al. 2001), the combined set now spans the northern part of the continent. In addition, samples from southern Europe, the Middle East, and sub-Saharan Africa were included in some analyses (Semino et al. 2000; Underhill et al. 2000; Cruciani et al. 2002). Our results reveal four main conclusions about the male-lineage variation in North Africa.


First, as shown in fig. 1B, the lineages that are most prevalent in North Africa are distinct from those in the regions to the immediate north and south: Europe and sub-Saharan Africa. This is illustrated by even a cursory examination of the commonest haplogroups: E3b2 is the most common haplogroup in North Africa, forming 42% of the combined sample. In contrast, R1b made up 55% of a mixed European sample (Underhill et al. 2000) and was even higher (77%) in the Iberian sample examined by Bosch et al. (2001), whereas E3a predominates in many sub-Saharan areas, being present at 64% in a pooled sample (Underhill et al. 2000; Cruciani et al. 2002). Such a finding is not surprising, in the light of the earlier genetic studies, but has an important implication: despite haplogroups shared at low frequency, suggesting limited gene flow, North African populations have a genetic history largely distinct from both Europe and sub-Saharan Africa over the timescales needed for the Y-chromosomal differentiation to develop.

Second, just two haplogroups predominate within North Africa, together making up almost two-thirds of the male lineages: E3b2 and J* (42% and 20%, respectively). E3b2 is rare outside North Africa (Cruciani et al. 2004; Semino et al. 2004 and references therein), and is otherwise known only from Mali, Niger, and Sudan to the immediate south, and the Near East and Southern Europe at very low frequencies. Haplogroup J reaches its highest frequencies in the Middle East (Semino et al. 2004 and references therein), whereas the J-276 lineage (equivalent to J* here) is most frequent in Palestinian Arabs and Bedouins. Lineages can rise to high frequency because of biological selection, social selection, and/or neutral drift. There is a suggestion that weak negative selection due to partial deletion of genes needed for spermatogenesis could act on both E3b2 and J (Repping et al. 2003), but this would tend to decrease their frequency, and there is no evidence for positive selection. It therefore seems likely that their increase was due to drift despite any negative selection, implying that male effective population size has been small. Indeed, gene diversity values increase along a latitudinal axis from west to east (fig. 2), and much of this variation is accounted for by haplogroup E3b2, which decreases in frequency in a corresponding fashion from ~76% in the Saharawis in Morocco to ~10% in Egypt (fig. 2). The same haplogroup has increased in frequency in many different populations within North Africa, so there must have been gene flow between them.

Third, there is strong geographical structure to the Y-chromosomal variation within the region. There is a high and significant correlation observed between genetic and geographical distances (r=0.55, P<.0005). Multidimensional scaling (MDS) analysis of genetic distances (Slatkin 1995) based on pairwise ΦST estimates (calculated using the program Arlequin) between 17 of the samples in fig. 1B showed a close correspondence with their relative geographical locations (fig. 3). Indeed, the positions of the samples in the MDS plot describe a latitudinal axis, from North Africa and the Middle East in the upper part to Central and southern Africa in the lower part. Furthermore, the pattern of genetic affinities among the North African samples parallels the west-east orientation quite precisely, from Morocco on the left-hand side to Egypt and the Middle East on the right. Spatial autocorrelation analysis (by AIDA; Bertorelle and Barbujani 1995) shows a clinal pattern of variation, more marked when Middle Eastern samples are included (fig. 4A and 4B). Haplogroup E3b2 itself shows a significant correlogram in a SAAP analysis (Sokal and Oden 1978) (fig. 4C). Furthermore, diversity within this haplogroup, measured using 15 Y-STRs (Thomas et al. 1999; Ayub et al. 2000), declines substantially towards the west (table A2 [online only]). These findings, together with the gene diversity pattern described above, are consistent with the hypothesis of a demic expansion from the Middle East.

Fourth, the time depth associated with the most common Y-chromosomal haplogroups in North Africa is shallow. Y-STR data (15 loci) were obtained for 256 Y chromosomes and revealed 201 different haplotypes (table A3 [online only]). Of these, only 16 were observed in more than one individual, but two were particularly frequent: one was present in 24 chromosomes from the Algerian Arab, Tunisian, and northern Egyptian populations, belonging, with one exception, to haplogroup E3b2*(xE3b2a); the second haplotype (observed in nine Tunisians) was associated with haplogroup J*. STR variability was used to estimate the TMRCA of North African chromosomes from individual haplogroups using the program BATWING (Wilson and Balding 1998), using either 15 loci (table A4 [online only]) or, to incorporate the Moroccan data (Bosch et al. 2001), 8 loci (table 2). The TMRCA of haplogroup E3b2 was estimated to be ~4.2 KY (95% CI 2.8–6.0 KY), using the mutation rate measured in father-son pairs (Kayser et al. 2000) and assuming 30 years per generation, or 6.9 (5.9–8.2) KY using the deduced “effective” mutation rate calibrated by historical events (Zhivotovsky et al. 2004) (table 2). The times for haplogroup J, the second-most-common haplogroup observed in North Africa (6.8 KY, 95% CI 4.4–11.1 KY; or 7.9 KY, 95% CI 6.6–9.1 KY) were also quite recent (table 2), supporting the idea of a recent demographic event. A network (Bandelt et al. 1999) of the E3b2*(xE3b2a) chromosomes, calculated using the program NETWORK, based on eight loci, showed a widespread high-frequency central haplotype (32%) and a starlike structure (fig. A1 [online only]). The Moroccan samples display low variability, and their chromosomes often occupy more-peripheral positions in the network. These findings together support our second conclusion, that genetic drift must have shaped the North African Y-chromosomal landscape.

Which historical or prehistorical demographic processes could explain the characteristics of the variation of Y-chromosomal lineages in North Africa? The current physical barriers, the Mediterranean Sea to the north and Sahara Desert to the south, could have provided genetic barriers leading to the separate evolutionary paths of the regions, although for the Sahara, episodes of more favorable climatic conditions could have relaxed this barrier at times, particularly during some intervals between ~10 KYA and ~5 KYA (Muzzolini 1993). There is no evident reason why it should have acted as a strong genetic barrier at such times, so, if there was substantial gene flow, the genetic differentiation between North and sub-Saharan Africa may postdate this period. A clinal pattern of haplogroup variation like the one we observe can be expected from an east-to-west population expansion, and the finding of lower E3b2 STR variation in the west than in central North Africa (table A2 [online only]), accompanied by a substantial increase in frequency of this haplogroup, is most readily explained by expansion into virtually uninhabited terrain by populations experiencing increasing drift (Barbujani et al. 1994).

The current distributions of the haplogroups can suggest geographical origins, and their TMRCAs provide some constraints on the times of their spread. The M35 lineage (see the phylogeny in fig. 1A for marker locations) is thought to have arisen in East Africa, on the basis of its high frequency and diversity there (Cruciani et al. 2004; Semino et al. 2004), and to have given rise to M81 in North Africa. The TMRCAs for E3b (8.3 KY, 95% CI 5.2–12.4 KY; or 14.4 KY, 95% CI 9.3–19.3 KY; table 2) and E3b2 (2.8–8.2 KY) should thus bracket the spread of E3b2 in North Africa. These times contrast sharply with estimates of 53 ± 21 KYA for the M35 lineage and 32 ± 11 KYA for the M81 lineage, by use of a constant-sized population model, or 30 ± 6 and 19 ± 4 KYA, respectively, by use of an expanding population model (Bosch et al. 2001). They are, however, more in accordance with times of 26.5 KYA (without a useful CI) for the M215 mutation (intermediate between M35 and M96 in the phylogeny; see fig. 1A) and 5.6 KYA for M81 (Cruciani et al. 2004) or of 29.2 ± 4.1 KYA for M35 and 8.6 ± 2.3 KYA for M81 (Semino et al. 2004). An origin for haplogroup J in the Middle East has been proposed (Semino et al. 2004 and references therein); the TMRCA of the J-M267 branch, found in both the Middle East and North Africa (and including our J* chromosomes), was estimated at 24.1 ± 9.4 KY and must predate its spread. This is consistent with our 95% TMRCA estimate of 4.4–11.1 KY for the North African chromosomes. Thus, although Moroccan Y lineages were interpreted as having a predominantly Upper Paleolithic origin from East Africa (Bosch et al. 2001), according to our TMRCA estimates, no populations within the North African samples analyzed here have a substantial Paleolithic contribution.

Early Neolithic sites are documented in the eastern part of North Africa and later ones in the west, which would be compatible with an east-to-west movement at this time, and this is also the case for the Arab expansion. Historical records of the Arab conquest, however, suggest that its demographic impact must have been limited (McEvedy 1980). In addition, genetic evidence shows that E3b2 is rare in the Middle East (Semino et al. 2004), making the Arabs an unlikely source for this frequent North African lineage. Parallel analyses between North Africa and Southern Europe have revealed strikingly similar patterns of Y chromosome variation which would support a scenario in which the Neolithic expansion, originating in the Middle East branched into two flows separated by the geographical barrier of the Mediterranean Sea. Indeed, as in North Africa, Y-chromosome variability in Southern Europe is clinal, gene diversity decreases from east to west, and genetic distances between North Africa and Southern Europe increase in a regular fashion from the Middle East toward the west (results not shown). Under the hypothesis of a Neolithic demic expansion from the Middle East, the likely origin of E3b in East Africa could indicate either a local contribution to the North African Neolithic transition (Barker 2003) or an earlier migration into the Fertile Crescent, preceding the expansion back into Africa.

In conclusion, we propose that the Y-chromosomal genetic structure observed in North Africa is mainly the result of an expansion of early food-producing societies. Moreover, following Arioti and Oxby (1997), we speculate that the economy of those societies relied initially more on herding than on agriculture, because pastoral economies probably supported lower numbers of individuals, thus favoring genetic drift, and showed more mobility than agriculturalists, thus allowing gene flow. Some authors believe that languages families are unlikely to be >10 KY old and that their diffusion was associated with the diffusion of agriculture (Diamond and Bellwood 2003). Since most of the languages spoken in North Africa and in nearby parts of Asia belong to the Afro-Asiatic family (Ruhlen 1991), this expansion could have involved people speaking a proto–Afro-Asiatic language. These people could have carried, among others, the E3b and J lineages, after which the M81 mutation arose within North Africa and expanded along with the Neolithic population into an environment containing few humans.

The Minoans, DNA and all.

Starting with the breaking DNA news, and this rather sinks the ‘Black Athena’ theory from Bernal…

DNA sheds light on Minoans

Crete’s fabled Minoan civilization was built by people from Anatolia, according to a new study by Greek and foreign scientists that disputes an earlier theory that said the Minoans’ forefathers had come from Africa.

The new study – a collaboration by experts in Greece, the USA, Canada, Russia and Turkey – drew its conclusions from the DNA analysis of 193 men from Crete and another 171 from former neolithic colonies in central and northern Greece.

The results show that the country’s neolithic population came to Greece by sea from Anatolia – modern-day Iran, Iraq and Syria – and not from Africa as maintained by US scholar Martin Bernal.

The DNA analysis indicates that the arrival of neolithic man in Greece from Anatolia coincided with the social and cultural upsurge that led to the birth of the Minoan civilization, Constantinos Triantafyllidis of Thessaloniki’s Aristotle University told Kathimerini.

“Until now we only had the archaeological evidence – now we have genetic data too and we can date the DNA,” he said.

Archeological dates for the colonisation of Crete are about 7,000 BC.

In more detail

The most frequent haplogroups among the current population on Crete were: R1b3-M269 (17%), G2-P15 (11%), J2a1-DYS413 (9.0%), and J2a1h-M319 (9.0%). They identified J2a parent haplogroup J2a-M410 (Crete: 25.9%) with the first ancient residents of Crete during the Neolithic (8500 BCE – 4300 BCE) suggesting Crete was founded by a Neolithic population expansion from ancient Turkey/Anatolia. Specifically, the researchers connected the source population of ancient Crete to well known Neolithic sites of ancient Anatolia: Asıklı Höyük, Çatalhöyük, Hacılar, Mersin/Yumuktepe, and Tarsus. Haplogroup J2b-M12 (Crete: 3.1%; Greece: 5.9%) was associated with Neolithic Greece. Haplogroups J2a1h-M319 (8.8%) and J2a1b1-M92 (2.6%) were associated with the Minoan culture linked to a late Neolithic/ Early Bronze Age migration to Crete ca. 3100 BCE from North-Western/Western Anatolia and Syro-Palestine (ancient Canaan, Levant, and pre-Akkadian Anatolia); Aegean prehistorians link the date 3100 BCE to the origins of the Minoan culture on Crete. Haplogroup E3b1a2-V13 (Crete: 6.7%; Greece: 28%) was suggested to reflect a migration to Crete from the mainland Greece Mycenaean population during the late Bronze Age (1600 BCE – 1100 BCE). Haplogroup J1 was also reported to be found in both Crete and Greece (Crete: 8.3%; Greece: 5.2%), as well as haplogroups E3b3, I1, I2, I2a, I21b, K2, L, and R1a1. No ancient DNA was included in this study of YDNA from the Mediterranean region.

So far the only information I can find on Cretan mitochondrial DNA places them overwhelmingly with the European and Near Eastern populations.

History

The first settlers introduced cattle, sheep, goats, pigs, and dogs, as well as domesticated cereals (wheat and barley) and legumes. The first settlers seem to be aceramic, the first ceramics appeared about a thousand years later. Quite possibly the technology was imported, as it appears in a fairly sophisticated form.

The plain chalice is an example of Pyrgos ware, one of the earliest forms of Cretan pottery. Minoan sites are commonly dated by the style of their pottery.

Minoan ceramics became increasingly ornate. After the Thera explosion and tsunami, marine creatures were frequently used to decorate the pottery.


The Minoans traded extensively with just about everyone in the Mediterranean, and Minoan pottery is often found in Egypt, Cyprus, the Cylades, and Mycenae. 

The Minoan palaces

The palace of Knossos, exterior.

And interior, other images here.

The inside of the palaces also had a flushing toilet and a primitive sort of shower. They were very advanced for the time. The same kind of indoor plumbing was found in Santorini, a Minoan colony

The first Palace was built around 2000 BC and destroyed 300 years later.

On the same site a new Palace was built, more elaborate than the previous, only to be severely damaged from an earthquake one hundred years latter.

During this period we see the development of a series of satellite buildings like the “Little Palace”, the “Royal Villa” and the “South House”. Knossos has now developed into a large city whose population – judged by the adjacent cemeteries – must have not been less than 100 000 inhabitants.

The Minoan civilisation was dealt a serious blow by the explosion of Santorini in 1645 BC. A major Tsunami about 15m high destroyed their fleet and coastal towns, and left them starving and vulnerable to invasion.

The Minoan society itself seemed to matriarchal and not particularly interested in warfare, although they did possess swords and other weapons. Mostly, the worship was of goddesses, carried out by priestesses. There was also the famous bull leaping ritual, depicted in it’s art repeatedly.

The Minoans developed their own writing system, known as linear A (as yet only partially deciphered) and Linear B. The Phaistos disc below is of an unknown script similar to Anatolian Heiroglyphs and Linear A, as yet undeciphered.


Five myths of race.

Here are my five myths of race, by Jon Entine. 

It’s an archived cut and paste, none of it is my work, barring a couple of comments.

The complete text is available through the link.

1. Humans are 99.9 percent the same. Therefore, race is “biologically meaningless.”

This statement finds its origins in the research of Harvard University geneticist Richard Lewontin during the 1960s. “Human racial classification is of no social value and is positively destructive of social and human relations,” Lewontin concluded in The Genetic Basis of Evolutionary Change in 1974. “Since such racial classification is now seen to be of virtually no genetic or taxonomic significance either, no justification can be offered for its continuance.”

Coming from a geneticist, Lewontin’s views had enormous influence and he was making a valid argument at the time. As Laval University anthropologist Peter Frost points out, Lewontin was referring to classic genetic markers such as blood types, serum proteins, and enzymes, which do show much more variability within races than between them. But his comments are widely misinterpreted even today to extend beyond that limited conclusion. Further research has shown this pattern of variability cannot reliably be extrapolated to all traits with higher adaptive value.

(It’s now 99.7% the same, the figure was corrected recently)

The 99.9 percent figure is based on DNA sequences that do not differ much between people or even between most mammals. As Jared Diamond, UCLA physiologist has noted, if an alien were to arrive on our planet and analyze our DNA, humans would appear as a third race of chimpanzees, who share 98.4 percent of our DNA. Just 50 out of the 32,00 genes that humans and chimps are thought to possess, or approximately 0.15 percent, may account for all of the cognitive differences between man and ape.

The impact of minute genetic differences is magnified in more sophisticated species. From a genetic perspective, humans and chimpanzees are almost identical because their genes code for similar phenotypes, such as bone structure, which are remarkably similar in many animals. For that matter, dogs share about 95 percent of our genome and mice 90 percent, which is why these species make good laboratory animals. Looked at another way, while the human genome contains some 32,000 genes, that’s not much more than the nematode worm (18,000), which is naked to the human eye. Humans only have 25 percent more genes than the mustard weed (26,000). The real story of the annotation of the human genome is that human beings do not have much more genomic information than plants and worms.

A large-scale study of the variability in the human genome by Genaissance Pharmaceuticals, a biotechnology company in Connecticut, has convincingly shown the fallaciousness of arguments tied to the 99.9 percent figure. The research shows that while humans have only 32,000 genes, there are between 400,000 and 500,000 gene versions. More specifically, they found that different versions of a gene are more common in a group of people from one geographical region, compared with people from another.

The implications are far reaching. By grouping individuals by the presence and variety of gene types, physicians may someday be able to offer treatments based on race or ethnic groups that will have been predetermined to work on a genetic level. Kenneth Kidd, a population geneticist at Yale University who is not connected to the study, said it confirmed the conclusions of those who have maintained that there is in fact considerable variability in the human population. He also chided the government and some genetic researchers for having stripped ethnic identities from the panel of people whose genomes have been searched for gene sequences. The study prompted Francis Collins, director of the National Human Genome Research Institute, to backtrack from earlier assertions that the small percentage of gross gene differences was meaningful or shed light on the debate over “racial” differences. “We have been talking a lot about how similar all our genomes are, that we’re 99.9 percent the same,” he said. “That might tend to create an impression that it’s a very static situation. But that 0.1 percent is still an awful lot of nucleotides.”

In other words, local populations are genetically far more different than the factoid that humans are 99.9 percent the same implies. The critical factor is not which genes are passed along but how they are patterned and what traits they influence.

2. The genetic variation among European, African and Asian populations is minuscule compared to differences between individuals within those populations.

This factoid, which is a variation on the first myth, has been elevated to the level of revealed truth. According to Lewontin, “based on randomly chosen genetic differences, human races and populations are remarkably similar to each other, with the largest part by far of human variation being accounted for by the differences between individuals.”

What does that mean? Not much by today’s nuanced understanding of genetics, it turns out. Consider the cichlid fish found in Africa’s Lake Nyas. The chiclid, which has differentiated from one species to hundreds over a mere 11,500 years, “differ among themselves as much as do tigers and cows,” noted Diamond. “Some graze on algae, others catch other fish, and still others variously crush snails, feed on plankton, catch insects, nibble the scales off other fish, or specialize in grabbing fish embryos from brooding mother fish.” The kicker: these variations are the result of infinitesimal genetic differences–about 0.4 percent of their DNA studied.

As retired University of California molecular biologist Vincent Sarich has noted, there are no clear differences at the level of genes between a wild wolf, a Labrador, a pit pull and a cocker spaniel, but there are certainly differences in gene frequencies and therefore biologically based functional differences between these within-species breeds.

There are other more fundamental problems resulting from misinterpretations of Lewontin’s original studies about gene variability. Numerous scientists since have generalized from his conclusions to the entire human genome, yet no such study has been done, by Lewontin or anyone else. Today, it is believed that such an inference is dicey at best. The trouble with genetic markers is that they display “junk” variability that sends a signal that variability within populations exceeds variability between populations. Most mammalian genes, as much as 70 percent, are “junk” that have accumulated over the course of evolution with almost no remaining function; whether they are similar or different is meaningless. The “junk” DNA that has not been weeded out by natural selection accounts for a larger proportion of within-population variability. Genetic makers may therefore be sending an exaggerated and maybe false signal.

The entire issue of gene variability is widely misunderstood. “In almost any single African population or tribe, there is more genetic variation than in all the rest of the world put together,” Kenneth Kidd told me in an interview in 1999. “Africans have the broadest spectrum of variability, with rarer versions at either end [of the bell curve distribution]. If everyone in the world was wiped out except Africans, almost all human genetic variability would be preserved.”

Many journalists and even some scientists have taken Kidd’s findings to mean that genetic variability equates with phenotypic variability. Since Africans have about 10–15 percent more genetic differences than people from anywhere else in the world, the argument goes, Africans and their Diaspora descendents should show more variability across a range of phenotypic characteristics including body type, behavior, and intelligence. This “fact” is often invoked to explain why athletes of African ancestry dominate elite running: it’s a product of variability, not inherent population differences.

This is a spurious interpretation of Kidd’s data. Chimpanzees display more genetic diversity than do humans. That’s because genetic variability is a marker of evolutionary time, not phenotypic variability. Each time an organism, human or otherwise, propagates, genetic “mistakes” occur as genes are mixed. The slightly increased variability in Africans reflects the accumulation of junk DNA as mutations have occurred over time. Such data “prove” little more than the fact that Africa is the likely home of modern humans–and it may not even signify that.

University of Utah anthropologist and geneticist Henry Harpending and John Relethford, a biological anthropologist from the State University of New York at Oneonta, have found that this genetic variation results from the fact that there were more people in Africa than everywhere else combined during most of the period of human evolution. In other words, greater African genetic variability may be the result of nothing more than fast population growth.

When I asked Kidd directly whether his findings of genetic variability, which showed that blacks meant that Africans were most likely to show the most phenotypic variability in humans–the tallest and shortest, the fastest and slowest, the most intelligent and most retarded–he laughed at first. “Wouldn’t that be mud in the eye for the bigots,” he said, not eager to puncture the politically correct balloon. Finally, he turned more serious. “Genes are the blueprint and the blueprint is identifiable in local populations. No matter what the environmental influences, you can’t deviate too far from it.”

Part of the confusion stems from the fact that some scientists, and certainly the general public, have embraced the popular shorthand that discrete genes have specific effects. This is sometimes expressed as there is a “gene for illness X.” Lewontin himself expresses scorn for what he calls the “religion” of molecular biology and their “prophets”, geneticists, who make grandiose statements about what genes prove or disprove. Genes only specify the sequence of amino acids that are linked together in the manufacture of a molecule called a polypeptide, which must then fold up to make a protein, a process that may be different in different organisms and depends in part on the presence of yet other proteins. “[A] gene is divided up into several stretches of DNA, each of which specifies only part of the complete sequence in a polypeptide,” Lewontin has written. “Each of these partial sequences can then combine with parts specified by other genes, so that, from only a few genes, each made up of a few subsections, a very large number of combinations of different amino acid sequences could be made by mixing and matching.” Lewontin’s reasonable conclusion: the mere sequencing of the human genome doesn’t tell us very much about what distinguishes a human from a weed, let alone a Kenyan from a Korean.

Significant between group differences have been identified in the harder-to-study regulatory genes. This tiny fraction of the human genome controls the order and make-up of proteins, and may be activated by obscure environmental triggers. For instance, the presence of an abnormal form of hemoglobin (hemoglobin S) can lead to sickle-cell anemia, which disproportionately afflicts families of African descent. But the genetic factors that actually lead to the disease operate at a much finer level. Just one change in the base pair for hemoglobin, can trigger the disease. However, the genetic factors involved are even subtler in part because of gene-gene and gene-environment interactions. For example, a separate set of genes in the genome–genes that code for fetal hemoglobin–can counteract some of the ill effects of the adult hemoglobin S genes if they continue to produce into adulthood. This range of possibilities, encoded in the genome, is found disproportionately in certain populations, but do not show up in the gross calculations of human differences that go into the misleading 99.9 percent figure.

Francois Jacob and Jacques Monod, who shared the Nobel Prize for Medicine in 1965 for their work on the regulator sequences in genes, have identified modules, each consisting of 20-30 genes, which act as an Erector Set for the mosaics that characterize each of us. Small changes in regulatory genes make large changes in organisms, perhaps by shifting entire blocks of genes on and off or by changing activation sequences. But, whether flea or fly, cocker spaniel or coyote, Brittany Spears or Marion Jones, the genetic sequences are different but the basic materials are the same. Minute differences can and do have profound effects on how living beings look and behave, while huge apparent variations between species may be almost insignificant in genetic terms.

3. Human differences are superficial because populations have not had enough evolutionary time to differentiate.

Stephen Jay Gould has periodically advanced an equally flawed argument: Human differences are superficial because populations have not had enough evolutionary time to differentiate. “Homo sapiens is a young species, its division into races even more recent,” Gould wrote in Natural History in November 1984.”This historical context has not supplied enough time for the evolution of substantial differences. … Human equality is a contingent fact of history.” In other words, our relatively recent common heritage–differentiation into modern humans may have occurred as recently as 50,000 years ago, an eye blink of evolutionary time–renders the possibility of “races” absurd.

This view has made its way into the popular media as fact. Yet, it’s difficult to believe that Gould believes his own rhetoric, for his own theory of punctuated equilibrium, which argues that swift genetic change occurs all the time, demolishes this assertion. A quarter century ago, Gould and American Museum of Natural History curator Niles Eldredge addressed the controversial issue of why the fossil records appeared to show that plants and animals undergo little change for long periods of time and then experience sudden, dramatic mutations. They argued that new species do not evolve slowly so much as erupt, the result of a chain reaction set off by regulatory genes. Their theory, though controversial and still widely debated, helps explain the limited number of bridge, or intermediary, species in the fossil record (as Creationists never fail to point out). Either as a mutation or in response to an environmental shock, these regulators could have triggered a chain reaction with cascading consequences, creating new species in just a few generations.

The evolutionary record is filled with such examples. A breakthrough study by University of Maryland population geneticist Sarah Tishkoff and colleagues of the gene that confers malarial resistance (one known as the G6PD gene) has concluded that malaria, which is very population specific, is not an ancient disease, but a relatively recent affliction dating to roughly 4,000-8,000 years ago. When a variant gene that promotes its owner’s survival is at issue, substantial differences can occur very rapidly. The dating of the G6PD gene’s variants, done by a method worked out by a colleague of Dr. Tishkoff’s, Dr. Andrew G. Clark of Pennsylvania State University, showed how rapidly a life-protecting variant of a gene could become widespread. The finding is of interest to biologists trying to understand the pace of human evolution because it shows how quickly a variant gene that promotes its owner’s survival can spread through a population. Genes that have changed under the pressure of natural selection determine the track of human evolution and are likely to specify the differences between humans and their close cousin the chimpanzee.

This new understanding of the swiftness of genetic change may ultimately help solve numerous evolutionary puzzles, including the origins of “racial differences.” For instance, there has been contradictory speculation about the origins of the American Indian population. Excavations have pushed the date of the initial migration to the Americas as far back as 12,500 years ago, with some evidence of a human presence as far as 30,000 years. The 1996 discovery of Kennewick Man, the 9,300-year-old skeleton with “apparently Caucasoid” features sparked speculation in the possibility of two or more migrations, including a possible arrival of early Europeans.

Using computer analysis of skeletal fragments, University of Michigan anthropologist C. Loring Brace argues that most American Indians are the result of two major migratory waves, the first 15,000 years ago after the last Ice Age began to moderate and the second 3,000-4,000 years ago. The first wave were believed to be members of the Jomon, a prehistoric people who lived in Japan thousands of years ago. Similar to Upper Paleolithic Europeans 25,000 years ago as well as the Ainu in Japan today and the Blackfoot, Sioux and Cherokee in the Americas, these populations have lots of facial and body hair, no epicanthic eyefold, longer heads, dark hair and dark eyes. Brace argues that the first waves was followed by a second migration consisting of a mixed population of Chinese, Southeast Asians, and Mongolians–similar in some respects to current populations of Northeast Asia–and are likely ancestors of the Inuits (Eskimo), Aleut, and Navajo.

Brace’s data does not resolve whether the two migratory waves consisted of distinct populations or rather different “samples” over time of the same population, whose physical appearance had changed as a result of selection pressures specific to that region, notably the cold, harsh climate. According to Francisco Ayala of the University of California at Irvine, co-author with Tishkoff of the malaria study, the genetic data suggests the remains represent a similar population at different evolutionary points in time. By this reasoning, various American Indian populations are the result of differing paces of evolution of various sub-pockets of populations. “We are morphologically no different in the different continents of the world,” he contends. This research may help explain how “racial” differences could occur so quickly after humans began their expansion from Africa, as recently as 50,000 years ago, Ayala adds.

These findings reinforce those of Vince Sarich. “The shorter the period of time required to produce a given amount of morphological difference, the more selectively important the differences become,” he has written. Sarich figures that since the gene flow as a result of intermingling on the fringes of population pockets was only a trickle, relatively distinct core races would likely have been preserved even where interbreeding was common.

Stanford University geneticist Luigi Cavalli-Sforza has calculated the time it could take for a version of a gene that leads to more offspring to spread from one to 99 percent of the population. If a rare variant of a gene produces just 1 percent more surviving offspring, it could become nearly universal in a human group in 11,500 years. But, if it provides 10 percent more “reproductive fitness,” it could come to dominate in just 1,150 years.

Natural selection, punctuated equilibrium, and even catastrophic events have all contributed to what might loosely be called “racial differences.” For example, University of Illinois archaeologist Stanley Ambrose has offered the hypothesis that the earth was plunged into a horrific volcanic winter after a titanic volcanic blow-off of Mount Toba in Sumatra some 71,000 years ago. The eruption, the largest in 400 million years, spewed 4,000 times as much ash as Mount St. Helens, darkening the skies over one third of the world and dropping temperatures by more than 20 degrees. The catastrophe touched off a six-year global winter, which was magnified by the coldest thousand years of the last ice age, which ended some fourteen thousand years ago. It is believed to have resulted in the death of most of the Northern Hemisphere’s plants, bringing widespread famine and death to hominid populations. If geneticists are correct, some early humans may have been wiped out entirely, leaving no more than 15,000 to 40,000 survivors around the world.

What might have been the effect on evolution? “Humans were suddenly thrown into the freezer,” said Ambrose. Only a few thousand people in Africa and a few pockets of populations that had migrated to Europe and Asia could have survived. That caused an abrupt “bottleneck,” or decrease, in the ancestral populations. After the climate warmed, the survivors resumed multiplying in what can only be described as a population explosion, bringing about the rapid genetic divergence, or “differentiation” of the population pockets.

This hypothesis addresses the paradox of the recent African origin model: Why do we look so different if all humankind recently migrated out of Africa? “When our African recent ancestors passed through the prism of Toba’s volcanic winter, a rainbow of differences appeared,” Ambrose has said. The genetic evidence is in line with such a scenario. Anna DiRienzo, a post-doctoral fellow working out of Wilson’s lab at Berkeley in the early 1990s, found evidence in the mitochondrial DNA data of a major population spurt as recently as thirty-thousand years ago.

What’s clear is that little is clear. Human differences can be ascribed to any number of genetic, cultural, and environmental forces, including economic ravages, natural disasters, genocidal pogroms, mutations, chromosomal rearrangement, natural selection, geographical isolation, random genetic drift, mating patterns, and gene admixture. Taboos such as not marrying outside one’s faith or ethnic group exaggerate genetic differences, reinforcing the loop between nature and nurture. Henry Harpending and John Relethford have concluded “human populations are derived from separate ancestral populations that were relatively isolated from each other before 50,000 years ago.” Their findings are all the more convincing because they come from somewhat competing scientific camps: Harpending advocates the out-of-Africa paradigm while Relethford embraces regional continuity.

Clearly, there are significant genetically-based population differences, although it is certainly true that dividing humans into discrete categories based on geography and visible characteristics reflecting social classifications, while not wholly arbitrary, is crude. That does not mean, however, that local populations do not show evidence of patterns. The critical factor in genetics is the arrangement of gene allele frequencies, how genes interact with each other and the environment, and what traits they influence. This inalterable but frequently overlooked fact undermines the notion that gene flow and racial mixing on the edges of population sets automatically renders all categories of “race” meaningless. As Frost points out, human characteristics can and do cluster and clump even without reproductive isolation. Many so-called “species” are still linked by some ongoing gene flow. Population genetics can help us realize patterns in such things as the proclivity to diseases and the ability to sprint fast.

4. “There are many different, equally valid procedures for defining races, and those different procedures yield very different classifications.”

This oft-repeated quote, written by Jared Diamond in a now-famous 1994 Discover article titled “Race Without Color”, was technically accurate, to a point. Many phenotypes and most complex behavior that depends on the brain–fully half of the human genome–do not fall into neat folkloric categories. In fact, there has been little historical consensus about the number and size of human “races”. Charles Darwin cited estimates ranging from two to sixty-three.

The problem with this argument, however, and the clumsy way it was presented, revolves around the words “equally valid.” Diamond appeared to embrace the post-modernist creed that all categories are “socially constructed” and therefore are “equally valid,” no matter how trivial. To make his point, he served up a bouillabaisse of alternate theoretical categories that cuts across traditional racial lines, including a playful suggestion of a racial taxonomy based on fingerprint patterns. A “Loops” race would group together most Europeans, black Africans and East Asians. Among the “Whorls,” we would find Mongolians and Australian aborigines. Finally, the “Arches” race would be made up of Khoisans and some central Europeans. “Depending on whether we classified ourselves by anti-malarial genes, lactase, fingerprints, or skin color,” he concluded, “we could place Swedes in the same race as (respectively) either Xhosas, Fulani, the Ainu of Japan, or Italians.”

Throughout the piece (and indeed throughout Guns, Germs, and Steel), Diamond appeared to want it both ways: asserting that all population categories, even trivial ones as he puts it, are equally meaningful, yet suggesting that some are more meaningful than others. In discussing basketball, for instance, he writes that the disproportionate representation of African Americans is not because of a lack of socio-economic opportunities, but with “the prevalent body shapes of some black African groups.” In other words, racial categories based on body shape may be an inexact indicator of human population differences–as are all categories of human biodiversity–but they are demonstrably more predictive than fingerprint whorls or tongue-rolling abilities.

It’s one thing to say that race is in part a folk concept. After all, at the genetic level, genes sometimes tell a different story than does skin color. However, it’s far more problematic to make the claim that local populations have not clustered around some genetically based phenotypes. However uncomfortable it may be to Diamond, some “socially constructed” categories are more valid than others, depending upon what phenotypes we are discussing. Moreover, geneticists believe that some of the traditional folkloric categories represent major human migratory waves, which is why so many characteristics group loosely together–for instance, body type, hair texture, and eye and skin color.

5. Documenting human group differences is outside the domain of modern scientific inquiry.

Even suggesting that there is a scientific basis for “racial” differences is baseless speculation, according to some social scientists. University of North Carolina-Charlotte anthropologist Jonathan Marks cavalierly dismisses evidence of patterned differences. “If no scientific experiments are possible, then what are we to conclude? he wrote to me in 1999. “That discussing innate abilities is the scientific equivalent of discussing properties of angels.”

From one perspective, Marks appears to be taking the road of sound, verifiable science: we can only know what we can prove. But he casts the issue in misleading terms, for no one familiar with the workings of genes refers to “innate abilities.” Our personal set of genes no more determines who we are than the frame of a house defines a home; much of the important stuff is added over time. There is no such thing as “innate ability” only “innate potential,” which has an indisputable genetic component. No amount of training can turn a dwarf into a NBA center, but training and opportunity are crucial to athletes with anatomical profiles of NBA centers.

Marks’s corollary assertion that truth rests only in the laboratory presents the antithesis of rigorous science. If every theory had to be vetted in a laboratory experiment, then everything from the atomic theory of matter to the theory that the earth revolves around the sun could be written off as “speculative”. As Steve Sailer writes, “you can’t reproduce Continental Drift in the lab. You can’t scoop up a few continents, go back a billion years, and then see if the same drift happens all over again.”

Ironically, the extremist position taken by Marks and parroted by many journalists mirrors the hard right stance of Darwin’s most virulent critics. While microevolution has been verified, the weakest link of evolutionary theory has always been the relatively meager evidence of transitional fossils to help substantiate macroevolution. “Evolution is not a scientific ‘fact,’ since it cannot actually be observed in a laboratory,” argued the Creation Legal Research Fund before the Supreme Court in an unsuccessful attack on evolution theory. “The scientific problems with evolution are so serious that it could accurately be termed a ‘myth.’” Arguing for the teaching of Creationism in schools, anti-evolution Senator Sam Brownback (R-Kansas) has said “we observe micro-evolution and therefore it is scientific fact; … it is impossible to observe macro-evolution, it is scientific assumption.”

Does the lack of scientific experiments substantiating macroevolution render all talk of evolution theory “the scientific equivalent of discussing properties of angels”? This ideological posturing disguised as science, whether it emanates from the fundamentalist right or the orhodox left, demonstrates a fundamental misunderstanding of the process of scientific reasoning, which rarely lends itself to “smoking guns” and absolute certainty. It also confuses function with process. We may not yet know how genes and nature interact to shape gender identity but that does not mean, as Marks would have it, that stating that genetics play a role is “speculative.” We have yet to find the genetic basis for tallness, yet we can be quite certain that it is more likely to be found in the Dutch, now the world’s tallest population, than in the Japanese. The search for scientific truth is a process. It may be years before we identify a gene that ensures that humans grow five fingers, but we can be assured there is one, or a set of them. There are patterned human differences even though the specific gene sequences and the complex role of environmental triggers are elusive.

The peopling of the Americas.

Europeans colonised America in 28,000 BC.

By Roger Highfield, Science Editor, in Washington DC
EUROPEANS colonised America up to 30,000 years ago, perhaps by crossing the Atlantic, according to a genetic analysis of native Americans that sheds light on their origins. By studying the DNA in “power packs” of cells called mitochondria, scientists can compare populations to reveal evidence of ancient migrations, the American Association for the Advancement of Science was told. Such work reveals four major lineages in native Americans which can be traced to Siberia and north-east Asia, notably in Baikal and Altai-Sayan.

However, a fifth – more minor – founding lineage, called haplogroup X, can be traced to Europe, and is found in North American populations, said Dr Theodore Schurr of the Southwest Foundation for Biomedical Research in San Antonio, Texas. Dr Schurr said: “This is one of the intriguing findings that we have come across recently. These data imply that haplogroup X was present in the New World long before Europeans first arrived in the New World, before Columbus or the Vikings or anybody else.”

The find has led to some speculation that ancient people crossed the Atlantic from the Old World, because evidence of the group has not so far been found in Asia, though he stressed that not all central Asian groups had been analysed. Dr Schurr said: “Haplogroup X was brought to the New World by an ancient Eurasian population in a migratory event distinct from those bringing the other four lineages to the Americas.”

The haplogroup X occurs most among Algonkian-speaking groups such as the Ojibwa, and has been detected in two pre-Colombian north American populations. Today, haplogroup X is found in between two and four per cent of European populations, and in the Middle East, he said, particularly in Israel.The complex origins of the first Americans has also been highlighted by an analysis of thousands of skulls from around the world. A team of anthropologists from the University of Michigan found that the study confirmed the complex origins of Native Americans that have been suggested by recent archeological and genetic studies.

fullimage_200362614578_546.gif

Using comparisons of thousands of ancient and modern skulls, collected over a period of 20 years and containing new data from Mongolia that became accessible just last summer, Prof Loring Brace showed how the native inhabitants of the Western Hemisphere fit into several different groups based on craniofacial patterns. Their studies show that descendants of the first humans to enter the New World, including natives of Mexico, Peru, and the southern United States, have no obvious ties to any Asian groups. He said: “This could be because they have been separated from their Asian sources for the longest period of time.”

A second group – including the Blackfoot, Iroquois, and other tribes from Minnesota, Michigan, Ontario, and Massachusetts – was descended from the Jomon, the prehistoric people of Japan. The Inuit appear to be a later branch from that same Jomon trunk. Tribal groups who lived down the eastern seaboard into Florida share this origin, according to prof Brace. Another group, originating in China and including the Athabascan-speaking people of the Yukon drainage of Alaska and north-west Canada, spread as far south as Arizona and northern Mexico.

He said: “Their craniofacial configuration allies them more closely to the living Chinese than to any other population in either hemisphere.”

I’d just like to comment that a group of haplotype X people were found in Kyrgztani Altains, although it’s the wrong type to be a parent of the native American type X, and it only arrived there a few thousand years ago with the Turkic peoples.

This shows the Canaries current, which sweeps off the North West coast of Africa and across the Atlantic. This journey has been done in a row boat in 43 days. It wouldn’t take complicated boats to make the journey, the current would have done most of the work. Recently, African illegal immigrants have been arriving at the Canary islands in large canoes, so it is possible to make long ocean voyages in them. There’s also the suggestion that Homo Erectus would have had to have been able to build boats to reach the island of Flores, so we’ve probably always had boats as modern humans.

 http://www.guardian.co.uk/world/2007/jul/31/spain.gilestremlett

Possible Evidence of Early Migrations to the Americas

Cave paintings
One indication of possible American aboriginal settlement of South America came from cave paintings in Serra da Capivara National Park in Brazil. The paintings, which some archaeologists claim are older than the supposed date of arrival of the Siberian migrations to the area, are in a style not seen elsewhere in native American art. Researchers also point to both the physical traits of human remains found at the sites and tool-making technology as highly distinct from that associated with the Clovis culture.

The elaborate ritual costumes shown in the paintings exhibit similarity to those used by Australian Aborigines as well as those used by the Fuegians, the natives of Tierra del Fuego. According to some researchers, such as Walter Neves of the University of Sao Paulo, the Fuegians (who were reduced to only one woman as of 2004) may be descendants of intermixing between American Aborigines and American Indians, and therefore the last surviving remnants of the original settlers.

Monte Verde
Monte Verde is an archaeological site in south-
central Chile that pre-dates the earliest known Clovis culture site of Clovis, New Mexico, by 1000 years. One layer at Monte Verde is estimated to date to 12,500 years before present, making it one of the earliest inhabited sites in the Americas. At that time, the Bering Strait route was blocked by huge glaciers, suggesting that Monte Verde’s inhabitants arrived long prior to dates associated with the Clovis culture, or via a different route. Another layer at Monte Verde has been radiocarbon dated to 33,000 B.P., although some archaeologists have questioned the methodology used to determine the older date.
Luzia reconstruction
More solid evidence was found in the 1970s by anthropologist Anette Laming-Emperaire. In limestone caves of Lagoa Santa region in central Brazil, she unearthed the skeleton of a 20-year old, 1.50 m tall woman, later nicknamed “Luzia” (or “Lucia”). Laming-Emperaire died before she had a chance to study it. Some 20 years later, Walter Neves found the skull in the Quinta da Boa Vista National Museum in Rio de Janeiro, and found that its measurements were quite different from those of the later peoples descended from the Siberian migration(s), and more similar to those of Australian Aborigines, Melanesians, and Negritos. This find, dated between 10,500 and 9,500 BC, was greeted with much skepticism by the anthropological community. However, the find was eventually confirmed by remains of over 70 individuals with similar characteristics found in that same region. This matter [1] [2] has been discussed at great length by Dewar (2001) These findings have been linked to the widespread Jigue legend [3] to suggest African San migrations to the New World.
The Pericúes
Another boost to the theory came when anthropologist Rolando González-José of the University of Barcelona demonstrated that the remains of the Pericúes, a tribe that lived in Baja California Sur until the 18th century, were quantitatively more similar to the Lagoa Santa finds than to any other group tested, and both were closer to the Australian Aborigines and Melanesians than to Siberians. The “anomalous” appearance of the Pericúes had already been noted by European visitors to the area. In 1909 French ethnologist Paul Rivet first proposed a trans-Pacific origin of this population, although a more recent settlement of Pacific islanders (i.e. within the last few millenia) could not be considered a pre-Siberian migration.

 Fuegans.
The Fuegians of Tierra del Fuego at the extreme tip of South America are thought to be physically, culturally and linguistically distinct from other Native Americans. Some proponents of this theory suggest they may be the descendants of both the relative newcomers from Asia and American Aborigines. Both Tehuelches and Selk’nams practiced body painting in a way not unlike that of Australian aboriginals. In contrast to most other Amerindian peoples, Fuegians appeared to be taller than most Europeans (See: Patagon myth).
Kennewick Man
Kennewick Man, whose remains were found in Washington State, does not resemble today’s Amerindians. Researchers suggested South-East Asian, Polynesian, Ainu or European or Caucasoid-like ancestry based on skull studies. If confirmed, this would lend support to a theory that an important migration route lay along the North Pacific shoreline from Asia to America during a time when inland routes were blocked by ice. DNA analysis, which some Native American groups oppose, could help resolve this mystery, should there be enough left intact to extract from the bones.

Kennewick man, skull and reconstruction.

http://www.answers.com/topic/pre-siberian-american-aborigines

Natives of South America (below). This page of the book is from “The New Student’s Reference Work: Volume 1” by Chandler B. Beach, Frank Morton McMurry and others.

1Guatuso, 2 Talamanoan Woman ,3 Bolivian Indian, 4 Guaykuru, 5 Caraja, 6 Matako, 7 Brazilian Indian ,8 Guayaqui ,9 Araucanian ,(Chile) 10 Tierra del Fuegan,11 Patagonian, 12 Botocudo Woman.

http://news.bbc.co.uk/1/low/sci/tech/430944.stm

Until now, native Americans were believed to have descended from Asian ancestors who arrived over a land bridge between Siberia and Alaska and then migrated across the whole of north and south America. The land bridge was formed 11,000 years ago during the ice age, when sea level dropped.

However, the new evidence shows that these people did not arrive in an empty wilderness. Stone tools and charcoal from the site in Brazil show evidence of human habitation as long ago as 50,000 years.

The site is at Serra Da Capivara in remote northeast Brazil. This area is now inhabited by the descendants of European settlers and African slaves who arrived just 500 years ago.

But cave paintings found here provided the first clue to the existence of a much older people. 

Images of giant armadillos, which died out before the last ice age, show the artists who drew them lived before even the natives who greeted the Europeans.

These Asian people have facial features described as mongoloid. However, skulls dug from a depth equivalent to 9,000 to 12,000 years ago are very different.

Walter Neves, an archaeologist from the University of Sao Paolo, has taken extensive skull measurements from dozens of skulls, including the oldest, a young woman who has been named Lucia.

“The measurements show that Lucia was anything but mongoloid,” he says. 

The next step was to reconstruct a face from Lucia’s skull. First, a CAT scan of the skull was done, to allow an accurate working model to be made.

Then a forensic artist, Richard Neave from the University of Manchester, UK, created a face for Lucia. The result was surprising: “It has all the features of a negroid face,” says Dr Neave.

The skull dimensions and facial features match most closely the native people of Australia and Melanesia. These people date back to about 60,000 years, and were themselves descended from the first humans, who left Africa about 100,000 years ago.

But how could the early Australians have travelled more than 13,500 kilometres (8,450 miles) at that time? The answer comes from more cave paintings, this time from the Kimberley, a region at the northern tip of Western Australia.

Here, Grahame Walsh, an expert on Australian rock art, found the oldest painting of a boat anywhere in the world. The style of the art means it is at least 17,000 years old, but it could be up to 50,000 years old.

And the crucial detail is the high prow of the boat. This would have been unnecessary for boats used in calm, inland waters. The design suggests it was used on the open ocean.

Fantastic voyage

Archaeologists speculate that such an incredible sea voyage, from Australia to Brazil, would not have been undertaken knowingly but by accident.

Just three years ago, five African fishermen were caught in a storm and a few weeks later were washed up on the shores of South America. Two of the fishermen died, but three made it alive.

But if the first Americans had drifted from Australia, where are their descendants now? Again, the skulls suggest an answer.

The shape of the skulls changes between 9,000 and 7,000 years ago from being exclusively negroid to exclusively mongoloid. Combined with rock art evidence of increasing violence at this time, it appears that the mongoloid people from the north invaded and wiped out the original Americans.

The only evidence of any survivors comes from Terra del Fuego, the islands at the remotest southern tip of South America.

The pre-European Fuegeans, who lived stone age-style lives until this century, show hybrid skull features which could have resulted from intermarrying between mongoloid and negroid peoples. Their rituals and traditions also bear some resemblance to the ancient rock art in Brazil.

The identity of the first Americans is an emotive and controversial question. But the evidence from Brazil, and a handful of people who still live at the very tip of South America, suggests that the Americas have been home to a greater diversity of humans than previously thought – and for much longer.

So far the only group that doesn’t seem to make a traceable appearance are the Africans, although claims have been made regarding  Negroid skulls being found in the Olmec area, there’s no DNA trace and every other anthropologist that had a look at the remains said they weren’t African. Given the cosmopolitan nature of ancient America, it would be a bit odd if they hadn’t made it over there at some point. Quite possibly, the ‘Australoid’ remains are part of a the very first population expansion out of Africa, straight across the Atlantic, as they would have looked a lot like modern Australoids. The remains found in the sites are extremely archaic in morphology. I’d love to know what mitochondrial DNA these people had, would they have been descended from ‘mitochondrial Eve’? Mungo man wasn’t.

The bones and DNA are pointing to a massacre of the first peoples by the current ‘first peoples’. It’s never a good sign when you only have the mitochondrial DNA of a people surviving.

Although, the. Great Lakes comet theory suggests that the older humans could have been at least partially wiped out by a comet impact about 13,000 years ago, clearing space for Newcomers up North

The myth that we are 99.9% the same.

Finding said to show “race isn’t real” scrapped.

Sept. 3, 2007
Special to World Science .

 A re­nowned sci­ent­ist has backed off a find­ing that he, joined by oth­ers, long touted as ev­i­dence for what they called a prov­en fact: that ra­cial dif­fer­ences among peo­ple are im­ag­i­nary.That idea—en­trenched to­day in ac­a­dem­ia, and of­ten used to cast­i­gate schol­ars who study race—has drawn much of its sci­en­tif­ic back­ing from a find­ing that all peo­ple are 99.9 per­cent ge­net­ic­ally alike.

But ge­net­icist Craig Ven­ter, head of a re­search team that re­ported that fig­ure in 2001, backed off it in an an­nounce­ment this week. He said hu­man varia­t­ion now turns out to be over sev­en times great­er than was thought, though he’s not chang­ing his po­si­tion on race.

Some oth­er sci­ent­ists have dis­put­ed the ear­li­er fi­gure for years as un­der­est­i­mat­ing hu­man va­ri­ation. Ven­ter, in­stead, has cit­ed the num­ber as key ev­i­dence that race is im­ag­i­nary. He once de­clared that “no se­ri­ous schol­ar” doubts that, though again, some re­cent stud­ies have con­tra­dicted it.

Ge­net­i­cist Ar­mand Ma­rie Leroi of Im­pe­ri­al Col­lege Lon­don wrote re­cently that a rec­og­ni­tion of race could in the fu­ture help so­ci­e­ty pro­tect en­dan­gered rac­es. The more com­mon past prac­tice was for so­cie­ties to op­press other races, which is large­ly what led some to try to ban­ish any rec­og­ni­tion of race al­to­geth­er.

Thus, views like Leroi’s have been largely marginal­ized. The race-is­n’t-real doc­trine pre­vails, typ­ic­ally por­trayed by back­ers as set­tled fact that only racists or their dupes could ques­tion. It “can be some­thing close to pro­fes­sion­al sui­cide” for re­search­ers to even sug­gest race ex­ists, psy­chi­a­trist Sa­lly Sa­tel wrote in the Dec. 2001-Jan. 2002 is­sue of the mag­a­zine Pol­i­cy Re­view.

Ven­ter did­n’t orig­i­nate the no­tion that race is­n’t real. But his sup­port of it has car­ried great weight be­cause he is some­thing of a star, thanks to his key role in the high-profile Hu­man Ge­nome Proj­ect, com­plet­ed in 2003.

In a tele­con­fer­ence on Mon­day, Ven­ter and col­leagues an­nounced their re­vised as­sess­ment of hu­man di­vers­ity, based on a study of Ven­ter’s own DNA. It was the first “diploid” ge­nome pub­lished to date, said Ven­ter and mem­bers of his re­search team at the J. Craig Ven­ter In­sti­tute in Rock­ville, Md. This means it was the first list­ing of the se­quence of let­ters of ge­net­ic code from both of a per­son’s chro­mo­some sets, the genes in­her­it­ed from the moth­er and the fa­ther.

The find­ings re­veal “hu­man-to-hu­man varia­t­ion is more than sev­en-fold great­er than ear­li­er es­ti­mates, prov­ing that we are in fact very un­ique in­di­vid­u­als at the ge­net­ic lev­el,” Ven­ter said. The 99.9 fi­gure might need to be lowered to about 99, he added. The find­ings are to ap­pear in the Oc­to­ber is­sue of the on­line re­search jour­nal PLoS Bi­ol­o­gy. Ven­ter added that the cost of se­quenc­ing an in­di­vid­ual per­son’s ge­nome is rap­idly drop­ping, and that a dec­ade from now, “thou­sands or tens of thou­sands” will have their DNA code writ­ten out.

He said the new find­ings were a pleas­ant sur­prise, as they show we’re not all “clones” as the pre­vious re­sults sug­gested.

The orig­i­nal es­ti­mate show­ing near-zero vari­abil­ity in the ge­nome, a prod­uct of the Hu­man Ge­nome Proj­ect, was a re­sult of the dif­fer­ent tech­nol­o­gy used for that work, said a col­league of Ven­ter’s, Ste­phen Scherer of the Hos­pi­tal for Sick Chil­dren in To­ron­to.

The tech­nique orig­i­nally used, Scherer said, could read the se­quence of let­ters of a ge­net­ic code. But it could­n’t de­tect repe­ti­tions of some parts of the code, which al­so oc­cur. Dif­fer­ences in the num­ber of these repe­ti­tions, called copy num­ber vari­ants, have since turned out to ac­count for much of the varia­t­ion in a species’ DNA. Anoth­er type of varia­t­ion re­cently found to be im­por­tant is called insertion-deletion vari­ants, snip­pets of code that are ei­ther ex­tra or mis­sing in some ge­nomes com­pared to oth­ers.

Some re­search­ers said that now that Ven­ter has dropped the 99.9 per­cent claim, he should al­so ad­mit race might exist. De­nial of that “ob­vi­ous” fact is “an ex­treme man­i­festa­t­ion of po­lit­i­cal cor­rect­ness,” wrote Rich­ard Lynn, a psy­chol­o­gist who has pro­posed links be­tween race and in­tel­li­gence, in an email. Lynn, of the Un­ivers­ity of Ul­ster in Ire­land, added that he thinks Ven­ter has un­fairly ma­ligned sci­ent­ists who be­lieve race ex­ists.

Ven­ter stuck to his guns. Race-isn’t-real pro­po­nents have other arg­u­ments be­side the 99.9 per­cent­age, though these are de­bated also. Ven­ter re­marked that even though vari­abil­ity is much great­er than once thought, hu­man popula­t­ions and traits blend to­geth­er every­where. That means each per­son could ar­bi­trarily di­vide hu­man­ity in­to a dif­fer­ent group of rac­es, if he so chose. Thus “race is a so­cial con­cept, not a sci­en­tif­ic one,” Ven­ter said, re­peat­ing a com­mon dic­tum.

Neil Risch of the University of California at San Francisco—who has led re­search chal­leng­ing that view—said he doesn’t feel ma­ligned by Venter’s state­ments on race and re­search­ers of it. But the data behind those claims really gave little new in­sight into po­pu­la­tion dif­fer­ences, and “I have always felt it is best to avoid en­tang­ling ge­ne­tics with po­li­tics,” Risch wrote in an e­mail.

I’m being lazy, and can’t be bothered to type in great long blog entries at the moment. I thought this was worth the space, as I keep seeing that same nonsensical ‘99.9% the same’ statistic knocking about. It’s ludicrous, because they still aren’t sure how many genes make up a human, so where they got that number from I don’t know.


The misleading concept of Mitochondrial Eve.

I’ve just discovered a major breakthrough in the Mitochondrial Eve story.

Apparently, and this is surprisingly important, Mt DNA is not a neutral gene. This means it is subject to natural selection. Less efficient Mt DNA types will get selected out. Suddenly, a lot of conflicting information from various sources stars to make sense. It also means that the absence of wildly different Mt DNA types that could have come from Neanderthals or Homo Erectus is totally meaningless, as they would have been selected out by the newer, better Mt DNA type from Africa. Multi-regionalism and the hybrid hypothesis are suddenly back in play.

The only thing the spread of Mt DNA now tells us, is it’s own spread. Think of the difference between a small twig in a stream, it is at the mercy of the currents (like a neutral gene). Then think of an insect or fish in the same stream. It can move in any direction, with the movement of the water only exerting a pressure to move in one way. This is the effect natural selection would have. What this means is that Mt Eve was probably NOT the result of a population bottleneck, she just had a mutation for a more effective energy conversion in her cells. And, as beneficial mutations tend to, this spread all over the world. What it doesn’t mean is that one group of Africans spread out all over the world, and that we are all really closely related. 

It also raises the question, “are Y chromosomes neutral genes?”. I’m going to go out on a limb and say, probably not. There are genes for various functions on the Y chromosome, Adam could just have produced more motile sperm. This would mean that Y chromosome Adam simply had a mutation that gave his DNA an advantage, so that it spread. Maybe it made him taller, or faster. It could be anything. It doesn’t mean he was at the head of a small bunch of intrepid pioneers colonising the planet.

Add this to the fact that some very ancient X chromosomes have been discovered in Asia and Africa, that date back one to two million years, and you can see how the recently out of Africa theory is look very shaky indeed.

Adam and Eve….never existed.