Yearly Archives: 2008

A very fast human evolutionary response to malaria

ma·lar·i·a  (m-lâr)

n.
1. An infectious disease characterized by cycles of chills, fever, and sweating, caused by a protozoan of the genus Plasmodium in red blood cells, which is transmitted to humans by the bite of an infected female anopheles mosquito.
 
 
Malaria is a disease so prevalent in the tropics that it seems like it’s always been there, but studies on the malaria genome suggest that it’s only between 3200–7000  old, which coincides with the development of farming on the West coast of Africa that led to the Bantu expansion (starting about 5,000 years ago).

The advent of malaria must have been pretty appalling. Imagine a population with absolutely no resistance to the disease. Even today, after generations of resistance selected into Africans, malaria is one of the biggest killers there is, particularly of young children, killing about 1 million people a year in Africa. In a population with no resistance, it must have wiped out whole early farming communities in lowland areas.

In a remarkably short space of time, in evolutionary terms at least, there have been multiple responses selected into the African and other tropical populations. One of these, the Duffy negative allele, is now very common; over 95% of Sub Saharan Africans are Duffy negative. However, virtually all non Africans are Duffy positive, probably meaning that in the few thousand years that malaria has existed, natural selection scrubbed out all the D+ people in Africa, and rapidly replaced them with D- carriers (it’s a recessive gene too). My money goes on the early Bantu people as the origin for the D- mutation. The few exceptions to this are other malaria-prone areas like Borneo and the Andaman islands, who have independently had similar mutations to make them Duffy negative.

Some other blood adaptations to malaria.

More detailed information here.

This makes a total of at least fourteen evolutionary responses (not counting blood type O) to malaria in the space of about 5,000 years. The most notorious and second most common defence is sickle cell, which offers a protective effect if you only carry one gene, but gives you sickle cell disease if you carry both. The distribution of sickle cell very neatly matches the areas with the highest risk of malaria.

Some anthropologist once wrote that if you could magically transport a Cro Magnon human from 20,000 years ago into the 21st century, he’d die from the first bout of normal ‘flu he caught. Ever since humans started farming we’ve been exposed to an onslaught of infectious diseases that hunter gatherers never had to deal with.  From the diseases caught from our animals (poxes and influenza) to normal human viruses given more virulence by increased population giving more scope for dangerous strains to arise, and more victims to catch them. These repeated selected sweeps for disease resistance are probably why the human skull shapes have seen more rapid divergence in the last 15,000 years than before (advent of farming).

I can’t help but wonder if the speed of Bantu expansion is partly due to their resistance to malaria. About 5,000 years ago the average African looked like a Khoisan, now they are mostly descended from Bantu settlers. Hunter gatherers generally don’t suffer as much from malaria, their population density is lower making the odds of an infected mosquito finding a human lower. But if you get a farming community turn up next door then there will be infected mosquitoes all over the place, and hunter gatherers just won’t have the same kind of resistance as the farmers. This would mean enough of the hunter gatherers would have died so the farmers have would find less opposition when they expand their territory into where the hunters were previously.

Mitochondrial DNA variation in Mauritania and Mali

Mitochondrial DNA Variation in Mauritania and Mali and their Genetic Relationship to Other Western Africa Populations.
 
A M González, V M Cabrera, J M Larruga, A Tounkara, G Noumsi, B N Thomas, J M Moulds
Universidad de La Laguna, Tenerife, Spain.
Mitochondrial DNA (mtDNA) variation was analyzed in Mauritania and Mali, and compared to other West African samples covering the considerable geographic, ethnic and linguistic diversity of this region. The Mauritanian mtDNA profile shows that 55% of their lineages have a west Eurasian provenance, with the U6 cluster (17%) being the best represented. Only 6% of the sub-Saharan sequences belong to the L3A haplogroup a frequency similar to other Berber speaking groups but significantly different to the Arabic speaking North Africans. The historic Arab slave trade may be the main cause of this difference. Only one HV west Eurasian lineage has been detected in Mali but 40% of the sub-Saharan sequences belong to cluster L3A. The presence of L0a representatives demonstrates gene flow from eastern regions. Although both groups speak related dialects of the Mande branch, significant genetic differences exist between the Bambara and Malinke groups. The West African genetic variation is well structured by geography and language, but more detailed ethnolinguistic clustering suggest that geography is the main factor responsible for this differentiation.

The 60,000 year old exit from Africa…that makes no sense at all.

It’s claimed to be about 60,000 years ago from the Horn of Africa..

Let me just say I’m with Stephen Oppenheimer on this one. That ‘60,000 years ago’ exit date is pretty impossible, for several reasons…

  • The age of the haplotype M mutation, occuring in the Pakistan? area is dated to 64,000 years ago at least.
  • There’s a modern human skull in Luijiang China 68,000 years old (at least) and quite likely older.
  • There’s evidence of modern humans under the mount Toba explosion 74,000 years old in the Malay peninsula
  • There’s evidence of modern humans on top of the Toba Ash, suggesting the population didn’t die out in East Asia
  • The age of Y chromosome Adam in Africa is estimated to be 60,000 BP 4,000 years after the date of the M mtDNA mutation in South Asia. There were also people in Far East Asia by then. They must have some men not descended from Y chromsome Adam to keep going, but they are not present now.  If that isn’t proof of selection in Y chromosmes I don’t know what is.

A good look at the Mt DNA of Pakistan and India shows some L haplotypes present in Asia, so it seems a good amount of lead time can be added to the 64,000 years date, as haplotype L ‘s seems to have got there a while before. Also, In an age that great for the estimated date of a MtDNA haplotype, even a minor percentage error can add up to ten thousand years and more.

After reading some of his articles, it seems Oppenheimer is behind the colonisation of Australia at the low tide date of 65,000 years. He then worked out that you’d need at least 10,000 years to reach there from Africa.

Add this 10,000 years to the 74,000 date (Toba date) and this gives you at least 85,000 years BP from the Gate of Tears (Red sea).

So essentially, you are looking at an exit date of at least 85,000 years and probably a lot older.

There’s also the issue of ‘was there really one exit ?’ To my knowledge the Nile has always flowed into the Mediterranean, making a permanent route to the Mahgreb. There does seem to be an early seperation of Mt DNA haplotype N and M, one swinging North into central Asia (from a Nile exit?) and the other following the coastal route into Australia.

This brings me to the issue of modern humans in North Africa, in Jebel Irhoud, dated to 160,000 years years ago. If modern humans were in North africa then, how did they first exit sub Saharan Africa 100,000 years later? Another seeming impossiblity. There still seems to have been a human population there 82,000 years ago, they left bones and beads.

This all leads me to question the validity of ‘one recent exit by the Gate of Tears’ quite deeply. Thismistrust of it is made stronger by a couple of studies that have concluded mt DNA is subject to natural selection, and is not a neutral marker, so it’s entirely possible for less successful lineages to die out (there’s evidence climate affects what lineages thrive).

One DNA study I’ve seen based on other DNA markers dated the split from the East African population at 120,000 BP, and the European split from Asians at about 40,000 BP. This would roughly fit the presence of modern humans in Israel at Skhul, at 125,000 BP. It also matches roughly the date at which Europeans started moving into Neanderthal territory, so I’m inclined to support this, and assume that the MtDNA dates are very wrong, for the older clades at least.

Then there’s the issue of Mungo man, mt DNA from him showed he wasn’t descended from mitochondrial Eve.

It has to be remembered that the world wasn’t empty of people at this time. Asia was full of Homo Erectus, and from Europe into Siberia there were Neanderthals. This wasn’t just a case of expanding into an empty territory, they had two subspecies (or races, the jury is out on that one) to wipe out. This would add to the time it took to get from A to B.

This also raises the point ‘were we ever really genetically isolated from Neanderthals and Homo Erectus?’, as AMH’s seem to have been mooching around in North Africa nearly the whole time before we officially exited Africa. The fact that the Jebel Irhoud remains were initially misidentified as Neanderthal should be a clue to the answer

The out of Africa theory makes no sense at all. Beats me how it remains the accepted paradigm.

Just a C Loring Brace paper mentioning the neolithic expansion.

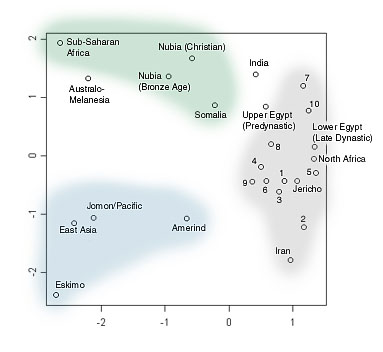
Clines and Clusters Versus “Race:” A Test in Ancient Egypt and the Case of a Death on the Nile

The biological affinities of the ancient Egyptians were tested against their neighbors and selected prehistoric groups as well as against samples representing the major geographic population clusters of the world. Two dozen craniofacial measurements were taken on each individual used. The raw measurements were converted into C scores and used to produce Euclidean distance dendrograms. The measurements were principally of adaptively trivial traits that display patterns of regional similarities based solely on genetic relationships. The Predynastic of Upper Egypt and the Late Dynastic of Lower Egypt are more closely related to each other than to any other population. As a whole, they show ties with the European Neolithic, North Africa, modern Europe, and, more remotely, India, but not at all with sub-Saharan Africa, eastern Asia, Oceania, or the New World.

From a C Loring Brace paper. Ignoring the racial study of ancient Egypt, but the bit that really caught my attention was the part in bold..

the fact that so many European Neolithic groups in Figure 4 tie more closely to the Late Dynastic Egyptians near the Mediterranean coast than they do with modern Europeans provides suggestive support for an eastern Mediterranean source for the people of the European Neolithic at an even earlier time level than Bernal suggests for the Egyptian-Phoenician colonization and influence on Greece early in the second millennium BC (Ammerman and Cavalli-Sforza, 1973, 1979; Bernal, 1987:2; Cavalli-Sforza et al., 1993; Sokal et al. 1991).

Which would be Turkey, judging by all the other bits and pieces I’ve collected. Going by the language dating (about 9,000 years) and the sudden appearance of all the crops from Turkey in Francthi cave 11,000 years ago, on top of the DNA evidence that suggests Crete was settled from Turkey… I’m thinking Turkey was the probable cradle of Western civilisation, with an expansion beginning somewhere about 11,00 years ago but really getting into full swing about 9,000 years ago.

The Asian origin of MtDNA haplotype M1.

Background

The out of Africa hypothesis has gained generalized consensus. However, many specific questions remain unsettled. To know whether the two M and N macrohaplogroups that colonized Eurasia were already present in Africa before the exit is puzzling. It has been proposed that the east African clade M1 supports a single origin of haplogroup M in Africa. To test the validity of that hypothesis, the phylogeographic analysis of 13 complete mitochondrial DNA (mtDNA) sequences and 261 partial sequences belonging to haplogroup M1 was carried out. 


Results

The coalescence age of the African haplogroup M1 is younger than those for other M Asiatic clades. In contradiction to the hypothesis of an eastern Africa origin for modern human expansions out of Africa, the most ancestral M1 lineages have been found in Northwest Africa and in the Near East, instead of in East Africa. The M1 geographic distribution and the relative ages of its different subclades clearly correlate with those of haplogroup U6, for which an Eurasian ancestor has been demonstrated. 


Conclusion

This study provides evidence that M1, or its ancestor, had an Asiatic origin. The earliest M1 expansion into Africa occurred in northwestern instead of eastern areas; this early spread reached the Iberian Peninsula even affecting the Basques. The majority of the M1a lineages found outside and inside Africa had a more recent eastern Africa origin. Both western and eastern M1 lineages participated in the Neolithic colonization of the Sahara. The striking parallelism between subclade ages and geographic distribution of M1 and its North African U6 counterpart strongly reinforces this scenario. Finally, a relevant fraction of M1a lineages present today in the European Continent and nearby islands possibly had a Jewish instead of the commonly proposed Arab/Berber maternal ascendance.

Another study came to the same conclusion.

Somali genetics.

High frequencies of Y chromosome lineages characterized by E3b1, DYS19-11, DYS392-12 in Somali males

We genotyped 45 biallelic markers and 11 STR systems on the Y chromosome in 201 male Somalis. In addition, 65 sub-Saharan Western Africans, 59 Turks and 64 Iraqis were typed for the biallelic Y chromosome markers. In Somalis, 14 Y chromosome haplogroups were identified including E3b1 (77.6%) and K2 (10.4%).The haplogroup E3b1 with the rare DYS19-11 allele (also called the E3b1 cluster ) was found in 75.1% of male Somalis, and 70.6% of Somali Y chromosomes were E3b1, DYS19-11, DYS392-12, DYS437-14, DYS438-11 and DYS393-13. The haplotype diversity of eight Y-STRs (‘minimal haplotype’) was 0.9575 compared to an average of 0.9974 and 0.9996 in European and Asian populations. In sub-Saharan Western Africans, only four haplogroups were identified. The West African clade E3a was found in 89.2% of the samples and the haplogroup E3b1 was not observed. In Turks, 12 haplogroups were found including J2*(xJ2f2) (27.1%), R1b3*(xR1b3d, R1b3f) (20.3%), E3b3 and R1a1*(xR1a1b) (both 11.9%). In Iraqis, 12 haplogroups were identified including J2*(xJ2f2) (29.7%) and J*(xJ2) (26.6%). The data suggest that the male Somali population is a branch of the East African population – closely related to the Oromos in Ethiopia and North Kenya – with predominant E3b1 cluster  lineages that were introduced into the Somali population 4000–5000 years ago, and that the Somali male population has approximately 15% Y chromosomes from Eurasia and approximately 5% from sub-Saharan Africa.

And a little extra detail…

In Somali males, 14 haplogroups were identified. The frequency of the clade E3b was 81.1%, including 77.6% of the haplogroup E3b1 defined by the M78 mutation. The Eurasian haplogroup K2 was found in 10.4%, and 3.0% of the Somali Y chromosomes belonged to the major clade J. Only 3.0% of the Somalis had the sub-Saharan African haplogroups A3, B and E3a*(xE3a4). Less than 2.0% of the Somalis belonged to the Northwest African E3b2 lineage. In the present study, no individual belonging to E3b* chromosomes carried the V6 mutation, which identifies a subset of chromosomes assigned to E3b* (E-M35

somy1

Mt DNA info on Somalia.

Analysis of mtDNA HVRII in several human populations using an immobilised SSO probe
hybridisation assay

Our Somali sample presents features that clearly locate it close to the African samples, but European features are also evident…. For a simple approach to measure the Caucasoid influence in East Africa, the triangle method described by Cavalli-Sforza et al was used to compute the proportion of admixture from the genetic distance matrix. Taking the British as a representative Caucasoid sample and the Mandenka as a sub-Saharan population, the proportion m of caucasoid lineages in the Somali is m = 0.46.  (46%) This value is similar to the estimate based on autosomal studies (m = 0.40), and clearly higher than the estimates for the mtDNA found in Ethiopians 1 (m = 0.05–0.27)

The autosomal studies show that as a whole Somalis are about 40% Eurasian, which is about the same as Ethiopians.  The maternal DNA is about 20% M1.

This shows a population movement from the Egypt/Nubia area to Somalia starting about 24,000 years ago.

The M78 mutation (y chromosome) that is present in East Africans occurred in North East Africa, not East Africa, and it occurred in a mixed Eurasian/African population.

This expansion was most likely from the Lower Nubia area, and might explain why Somalis show some similarities to the ancient upper Egyptians (Badarians); as their ancestry comes fromthe same region, and they are less influenced by later migrations from Arabia and west Africa. The hg’s involved ( M78/E3b1 and M1/M1a) are shown below, showing a clear focus and origin in Southern modern Egypt (Lower Nubia), expanding into Somalia .

all-three1

Diagram; “Clines and Clusters Versus Race“, C. Loring Brace. Showing skull similarities in Somalians and predynastic upper Egyptians (lower Egyptians are much more like modern North Africans). The PD Upper Egyptians are just outside the range of modern North Africans, and Somalians show a fairly close relationship to them; unsurprisingly, as a fairly large portion of Somali ancestry seems to come from the Upper Egypt/Nubia area.

Another Y chromosome study showing a back migration into Africa from Asia.

A back migration from Asia to sub-Saharan Africa is supported by high-resolution analysis of human Y-chromosome haplotypes.

The variation of 77 biallelic sites located in the nonrecombining portion of the Y chromosome was examined in 608 male subjects from 22 African populations. This survey revealed a total of 37 binary haplotypes, which were combined with microsatellite polymorphism data to evaluate internal diversities and to estimate coalescence ages of the binary haplotypes. The majority of binary haplotypes showed a nonuniform distribution across the continent. Analysis of molecular variance detected a high level of interpopulation diversity (PhiST=0.342), which appears to be partially related to the geography (PhiCT=0.230). In sub-Saharan Africa, the recent spread of a set of haplotypes partially erased pre-existing diversity, but a high level of population (PhiST=0.332) and geographic (PhiCT=0.179) structuring persists. Correspondence analysis shows that three main clusters of populations can be identified: northern, eastern, and sub-Saharan Africans. Among the latter, the Khoisan, the Pygmies, and the northern Cameroonians are clearly distinct from a tight cluster formed by the Niger-Congo-speaking populations from western, central western, and southern Africa. Phylogeographic analyses suggest that a large component of the present Khoisan gene pool is eastern African in origin and that Asia was the source of a back migration to sub-Saharan Africa. Haplogroup IX Y chromosomes appear to have been involved in such a migration, the traces of which can now be observed mostly in northern Cameroon.

I’m just to tired to focus on this right now.. I’ll read it later.

Click to images to see full size.

Egyptian mummy reconstructions.

I’m in an Egyptian mood this week.

There have been a few reconstructions of Egyptian mummies, and I’ve done my best to track them all down.

Lets start with the really big names first.

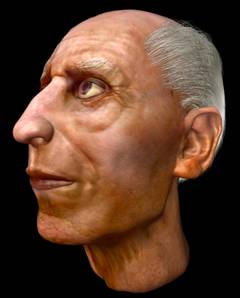
Ramses II

This is a slightly incorrect reconstruction, as the very elderly king (in his nineties) had his hair hennaed to a light auburn colour to make him look younger. It’s also likely, since he was a natural red head (and of Libyan descent) that his skin tone was a few shades lighter, as nobles wouldn’t have gone out in the sun much.

Tutankhamun.

The Mummy of King Tutanhkamun was carefully placed in a cat scanner, and an image made of his skull, created without damaging him.They gave a model of the skull to three teams, one American, one Egyptian and one French. They then let them all use their varying techniques. This very lifelike one is the French reconstruction with a silicon skin.

These computer rendered images also support the French reconstruction. The grey one is the American one, and they were working blind on it. They identified it as a Caucasian North African, and after taking a little time to decide the sex (as he had a very feminine skull) they come up with the very weak chinned young man you see here. The jawline on the Egyptian one is somewhat stronger (suspiciously so). I think they may have ‘butched him up’ a touch.

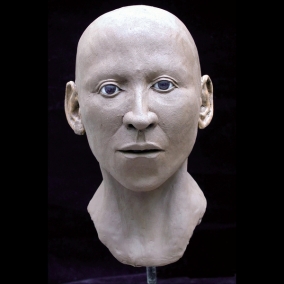
‘Nefertiti’

First of all I’d like to say that this looks absolutely nothing like the bust of her. The busts of Nefertiti all have much thinner lips and the face is less angular with rounder cheekbones, and the shape of the eyebrows is totally wrong. The skin tone is also well off the skin colour of the bust, she’s a should be a much pinker tone. But, it may well be an accurate representation of the mummy it’s of, as the identity of Nefertiti is up for debate. I think the fact that this recon doesn’t look anything like the bust suggests it’s not Nefertiti they’ve got their hands on here.

Asru

Asru was a chantress (temple singer) of fifty or sixty years old. When she died she appeared to have been in poor health for quite some time, suffering a slipped disc, ear infection and a cyst due to a parasitic infection that would have caused shortness of breath and chest pain. She also suffered from schistosomiasis. 

Harwa.

This man dates from the twenty second or twenty third dynasty, about 945–715 BC. There’s a link to the reconstruction process here.

 Pesed and ‘Bess’

Pesed was a fifty five to seventy year old woman from 300 BC, who lived in Akhmim.

‘Bess’ was five feet tall and died between 25 and 35. She was likely from a wealthy family and died died 3,000 to 3,500 years ago. She was modeled by high-resolution CT scans, which captured detailed visual slices every millimeter.

Nefer-ii-ne and Natsef Amun

Nefer-ii-ne dates to around 250 BC. She looks a lot like like a Nigerian comedienne you see on British TV, and appears to be fairly prognathic, so I’m guessing she had pretty dark skin, as does the man next to her…

Natsef Amun was a priest at the temple of Karnak from 1,100 BC. He died in middle age. He appears to be strongly Nubian in appearance, which isn’t uncommon in Upper (Southern) Egyptians

Nesperennub

Recently reconstructed by the British museum. He died about 800 BC. There’s a link to the Museum article on the reconstruction here. If you think the cat scan image is a bit odd, it’s because he’s wearing a bowl on his head. Apparently as part of the mummification process.

Ta-irty bai

Reconstructed from a CT scan by the Akhmim Mummy Studies Consortium. She dates to the 3rd century BC. She was aged 35 to 40 when she died, about the average for ancient Egypt.

‘Annie’ and Peten-Amun

This is the body of an unnamed teenage girl from Akhmim circa 250 BC.

Peten-Amun was a minor priest from the early Ptolemaic era (300 BC) who died aged about sixty, a long life by Egyptian standards.

Bodiless mummy head

Digitally reconstructed. You can see his grey beard and thin hair more clearly on the mummy though. 

Racial differences in skull shape.

Firstly, the mostly obvious difference is that the Caucasoid top skull has a very flat profile, while the bottom skull is ‘prognathic’, meaning it’s jaws protrude out. Although not obvious from this image, the nose aperture of the Caucasian skull has a narrower triangle shape; with a longer, thinner bony protrusion at the point where the nose comes out from between the eyes (nuchal ridge). Caucasian skulls also posess a nasil sill (unless you see this shown, no explanation will make sense), Asian and African skulls don’t.


This site will give you all the detailed info if you are interested.

Gender quiz.

 Who is Martha and who is Arthur?

So, I finally finished this mini-experiment.

I asked two sets of questions, one to ascertain if the colouring of the face affected the way people perceived their gender,  and one to see if naming them by placing the names ‘Arthur and Martha’ above them would have any affect (the colouring based test had no names).

When asked, most people picked Left as the male and Right as the woman, by a 4:1 ratio.

But when primed by the placing of the names, they picked Left as the woman by a 2:1 ratio. There were almost as many don’t knows as picked right as female.

The reason I did this?

I’ve seen some studies that suggest women have naturally lighter skin and hair colour, but slightly darker eyes. The general response, showing a stronger response to colouring than to the not very subtle naming of the faces, suggests people do associate lighter colouring with women. There was a fairly large ‘don’t know’ response when the face were named too, showing some confusion in my guinea pigs.

This observation that women have lighter skin might explain the preference for lighter skinned women in a lot of cultures. It’s not something that’s been introduced by conquering Europeans, it’s just a natural preference for a sexually dimorphic trait.